USD/JPY Price Forecast: Likely find direction in this US CPI week
- USD/JPY trades calmly near 158.36 with focus on the US CPI data.
- The US CPI is expected to have grown at a faster pace in September.
- The BoJ is unlikely to deliver back-to-back interest rate hikes.

The Japanese Yen (JPY) trades almost flat at around 158.36 against the US Dollar (USD) at the start of the week. The USD/JPY pair has been in a tight range between 156.38 and 158.51 for almost two weeks.
This week, the pair is expected to find direction as the United States (US) Consumer Price Index (CPI) data for September is scheduled to be published on Wednesday. The inflation data is expected to influence Federal Reserve’s (Fed) interest rate expectations significantly.
Recent comments from Fed board members that they are highly concerned about inflation remaining elevated for a long period.
The US CPI report is expected to show that the headline inflation accelerated to 3.7% Year-on-Year (YoY) from 3.4% in August. The core CPI – which excludes volatile items such as food and energy – is seen higher at 2.5% YoY from the previous reading of 2.4%.
On Tokyo front, market experts argue against back-to-back interest rate hikes from the Bank of Japan (BoJ).
BoJ seen shifting to inflation stabilisation but not yet ready for rapid hikes
Analysts at Rabobank argue that the Bank of Japan has reached an important inflection point, noting that “it now appears to have reached the point when it can instead shift its focus to stabilising price pressures around the target level.” However, they caution that this does not herald an aggressive tightening cycle, stressing that “even so, the Bank is still not widely viewed as being in a position in which back-to-back rate rises are appropriate.”
USD/JPY Technical Analysis
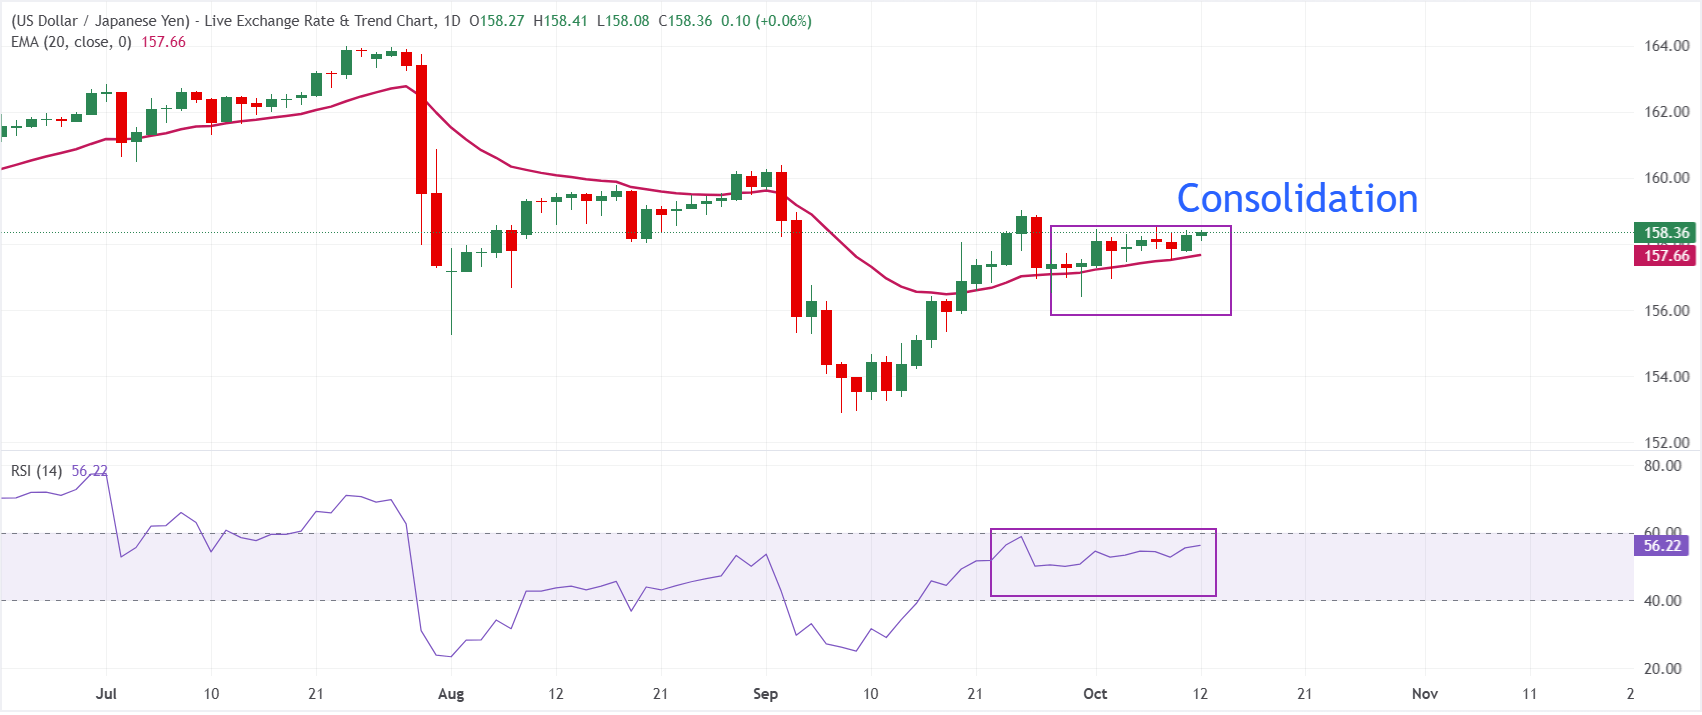
In the daily chart, USD/JPY trades at 158.37. The pair maintains a constructive near-term bias as spot holds above the 20-day Exponential Moving Average (EMA) at 157.66, keeping the recent rebound technically supported. The pair has remained inside the 156.38-158.51 range for almost two weeks.
The 14-day Relative Strength Index (RSI) at 56.28 leans to the bullish side of neutral, suggesting buyers retain control but without pushing the market into overbought territory yet.
On the downside, initial support is located at the 20-day EMA around 157.66, where a daily close below would hint at fading upside momentum and open the door to a deeper corrective phase. Looking up, the September 24 high at 159.04 is the major hurdle for the pair.
(The technical analysis of this story was written with the help of an AI tool. Know more.)
Inflation FAQs
Inflation measures the rise in the price of a representative basket of goods and services. Headline inflation is usually expressed as a percentage change on a month-on-month (MoM) and year-on-year (YoY) basis. Core inflation excludes more volatile elements such as food and fuel which can fluctuate because of geopolitical and seasonal factors. Core inflation is the figure economists focus on and is the level targeted by central banks, which are mandated to keep inflation at a manageable level, usually around 2%.
The Consumer Price Index (CPI) measures the change in prices of a basket of goods and services over a period of time. It is usually expressed as a percentage change on a month-on-month (MoM) and year-on-year (YoY) basis. Core CPI is the figure targeted by central banks as it excludes volatile food and fuel inputs. When Core CPI rises above 2% it usually results in higher interest rates and vice versa when it falls below 2%. Since higher interest rates are positive for a currency, higher inflation usually results in a stronger currency. The opposite is true when inflation falls.
Although it may seem counter-intuitive, high inflation in a country pushes up the value of its currency and vice versa for lower inflation. This is because the central bank will normally raise interest rates to combat the higher inflation, which attract more global capital inflows from investors looking for a lucrative place to park their money.
Formerly, Gold was the asset investors turned to in times of high inflation because it preserved its value, and whilst investors will often still buy Gold for its safe-haven properties in times of extreme market turmoil, this is not the case most of the time. This is because when inflation is high, central banks will put up interest rates to combat it. Higher interest rates are negative for Gold because they increase the opportunity-cost of holding Gold vis-a-vis an interest-bearing asset or placing the money in a cash deposit account. On the flipside, lower inflation tends to be positive for Gold as it brings interest rates down, making the bright metal a more viable investment alternative.
Author

Sagar Dua
FXStreet
Sagar Dua is associated with the financial markets from his college days. Along with pursuing post-graduation in Commerce in 2014, he started his markets training with chart analysis.

















