USD/JPY Price Forecast: Buyers defend 100-day SMA after intervention-driven volatility
- USD/JPY extends gains for a third straight day as hotter US inflation data boosts Fed rate hike expectations and supports the US Dollar.
- Rising Oil prices linked to the Middle East war continue to pressure the Japanese Yen given Japan’s heavy dependence on imported energy.
- Technically, USD/JPY holds above key moving averages while momentum indicators suggest the recent intervention-driven sell-off may be stabilizing.

USD/JPY trades with a mild upside bias on Wednesday as the Japanese Yen (JPY) remains under pressure from a stronger US Dollar (USD) and rising Oil prices linked to the Middle East war, given Japan’s heavy reliance on imported energy.
At the time of writing, USD/JPY is trading around 157.87, up for a third consecutive day. The US Dollar is drawing support from hotter-than-expected US inflation data, which boosted expectations that the Federal Reserve (Fed) could raise interest rates by year-end, while persistent uncertainty surrounding US-Iran negotiations to end the war is driving safe-haven flows into the Greenback.
The US Dollar Index (DXY), which tracks the USD against a basket of six major currencies, is trading around 98.50, its highest level in more than a week.
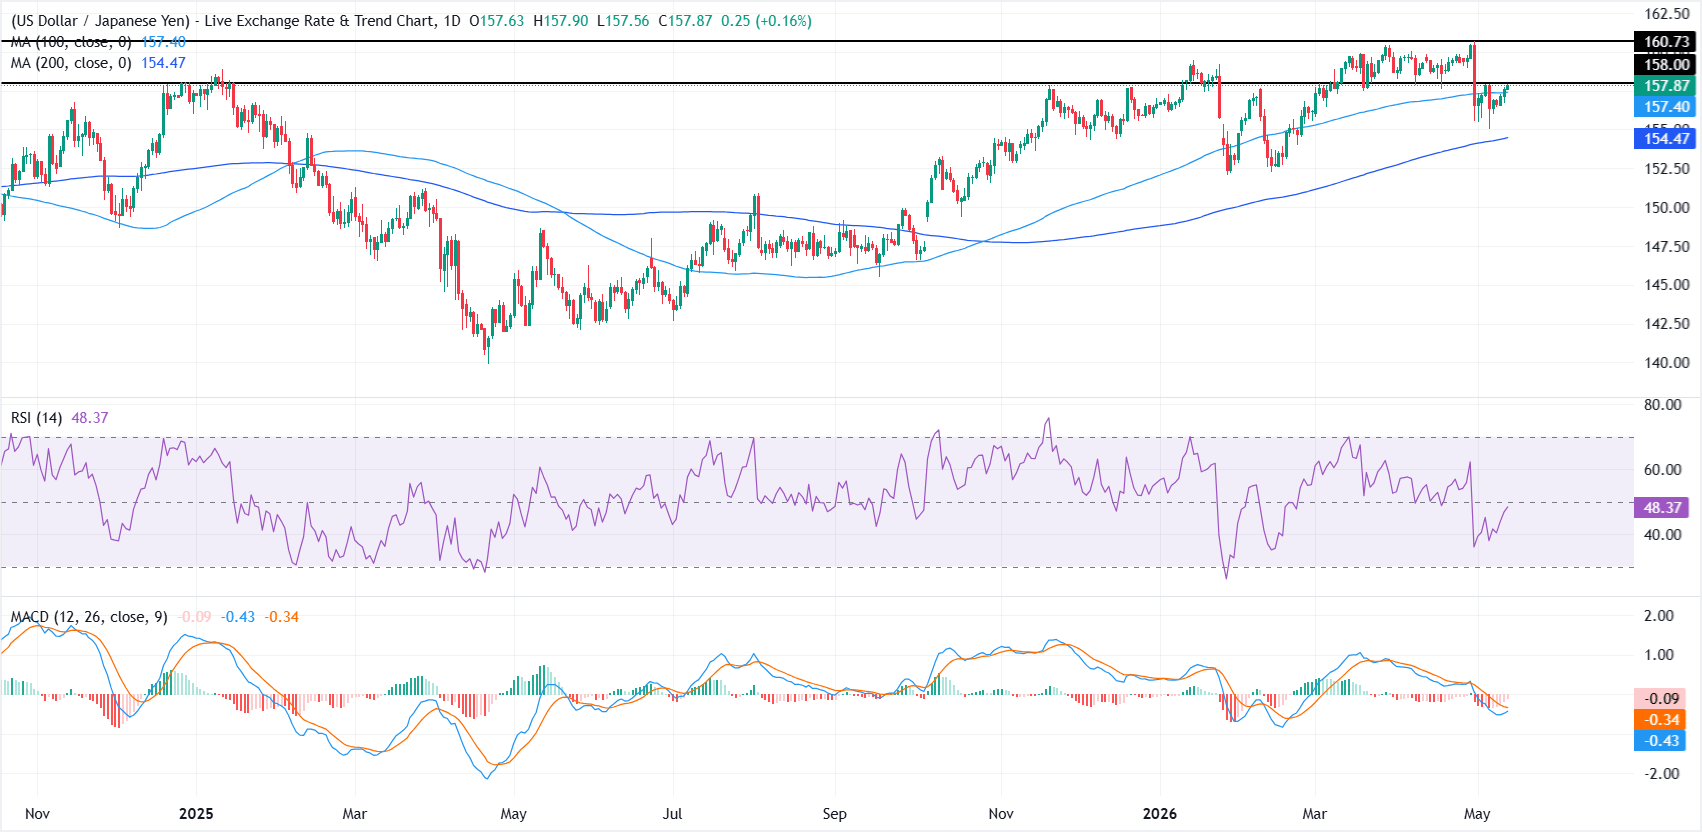
From a technical perspective, buyers are gradually returning after the recent suspected intervention-driven sell-off triggered near the 160.00 psychological level.
USD/JPY trades at 157.85, holding a constructive bias as it remains above the 100-day Simple Moving Average (SMA) at roughly 157.40 and the 200-day SMA near 154.47.
The Relative Strength Index (RSI) on the daily chart has rebounded toward 48 after recently dipping toward oversold territory, suggesting bearish momentum is easing but still lacking strong bullish conviction.
Meanwhile, the Moving Average Convergence Divergence (MACD) remains in negative territory, though the histogram is beginning to stabilize and the MACD line is attempting to turn higher, indicating downside pressure may be fading after the recent sell-off.
On the topside, initial resistance emerges at 158.00, where a horizontal barrier caps immediate advances, ahead of a more significant ceiling near 160.73 that guards the recent highs.
On the downside, the 100-day SMA at 157.40 offers the first layer of support, with the 200-day SMA around 154.47 providing a deeper structural floor if selling pressure extends.
Inflation FAQs
Inflation measures the rise in the price of a representative basket of goods and services. Headline inflation is usually expressed as a percentage change on a month-on-month (MoM) and year-on-year (YoY) basis. Core inflation excludes more volatile elements such as food and fuel which can fluctuate because of geopolitical and seasonal factors. Core inflation is the figure economists focus on and is the level targeted by central banks, which are mandated to keep inflation at a manageable level, usually around 2%.
The Consumer Price Index (CPI) measures the change in prices of a basket of goods and services over a period of time. It is usually expressed as a percentage change on a month-on-month (MoM) and year-on-year (YoY) basis. Core CPI is the figure targeted by central banks as it excludes volatile food and fuel inputs. When Core CPI rises above 2% it usually results in higher interest rates and vice versa when it falls below 2%. Since higher interest rates are positive for a currency, higher inflation usually results in a stronger currency. The opposite is true when inflation falls.
Although it may seem counter-intuitive, high inflation in a country pushes up the value of its currency and vice versa for lower inflation. This is because the central bank will normally raise interest rates to combat the higher inflation, which attract more global capital inflows from investors looking for a lucrative place to park their money.
Formerly, Gold was the asset investors turned to in times of high inflation because it preserved its value, and whilst investors will often still buy Gold for its safe-haven properties in times of extreme market turmoil, this is not the case most of the time. This is because when inflation is high, central banks will put up interest rates to combat it. Higher interest rates are negative for Gold because they increase the opportunity-cost of holding Gold vis-a-vis an interest-bearing asset or placing the money in a cash deposit account. On the flipside, lower inflation tends to be positive for Gold as it brings interest rates down, making the bright metal a more viable investment alternative.
Author

Vishal Chaturvedi
FXStreet
I am a macro-focused research analyst with over four years of experience covering forex and commodities market. I enjoy breaking down complex economic trends and turning them into clear, actionable insights that help traders stay ahead of the curve.
















