- USD/CNH retreats from four-week-old horizontal resistance, tests weekly support line.
- Bullish MACD signals, sustained trading above 200-SMA keeps buyers hopeful.
- Buyers have multiple hurdles to cross stay on merit versus the sellers.
USD/CNH consolidates recent gains around the monthly high, retreating from a short-term horizontal resistance towards 6.7700 during Tuesday’s Asian session.
In doing so, the offshore Chinese yuan (CNH) pair eases from a four-week-long hurdle as sellers attack the weekly support line near the 6.7700 threshold. Also challenging the USD/CNH bulls is the market's positioning ahead of the Wednesday's Federal Open Market Committee (FOMC). Additionally, growing chatters surrounding the People's Bank of China's (PBOC) next move could also be linked to the quote's latest pullback.
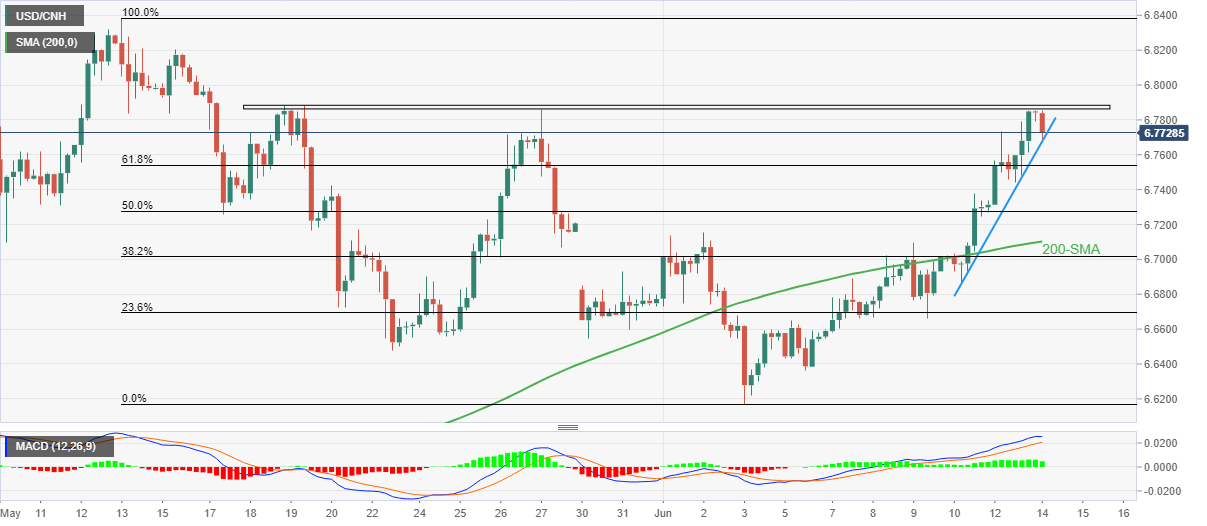
It’s worth noting, however, that the bullish MACD signals and the quote’s ability to stay beyond the 200-SMA keep the USD/CNH buyers hopeful until the prices drop below the stated key SMA level of 6.7100.
Even so, a downside break of the immediate support can direct the 61.8% and 50% Fibonacci retracements of the May-June downturn, respectively around 6.7540 and 6.7280.
Alternatively, recovery moves need to cross the nearby resistance surrounding 6.7865-85, as well as cross the 6.7900 round figure, to recall the USD/CNH buyers.
Following that, multiple resistances around 6.8200 and 6.8300 could probe the pair bulls before directing them towards the yearly peak of 6.8384.
Overall, USD/CNH remains on the bull's radar ahead of this week's key data/events, despite the latest profit-booking moves.
USD/CNH: Four-hour chart
Trend: Pullback expected
Information on these pages contains forward-looking statements that involve risks and uncertainties. Markets and instruments profiled on this page are for informational purposes only and should not in any way come across as a recommendation to buy or sell in these assets. You should do your own thorough research before making any investment decisions. FXStreet does not in any way guarantee that this information is free from mistakes, errors, or material misstatements. It also does not guarantee that this information is of a timely nature. Investing in Open Markets involves a great deal of risk, including the loss of all or a portion of your investment, as well as emotional distress. All risks, losses and costs associated with investing, including total loss of principal, are your responsibility. The views and opinions expressed in this article are those of the authors and do not necessarily reflect the official policy or position of FXStreet nor its advertisers. The author will not be held responsible for information that is found at the end of links posted on this page.
If not otherwise explicitly mentioned in the body of the article, at the time of writing, the author has no position in any stock mentioned in this article and no business relationship with any company mentioned. The author has not received compensation for writing this article, other than from FXStreet.
FXStreet and the author do not provide personalized recommendations. The author makes no representations as to the accuracy, completeness, or suitability of this information. FXStreet and the author will not be liable for any errors, omissions or any losses, injuries or damages arising from this information and its display or use. Errors and omissions excepted.
The author and FXStreet are not registered investment advisors and nothing in this article is intended to be investment advice.
Recommended content
Editors’ Picks
AUD/USD posts gain, yet dive below 0.6500 amid Aussie CPI, ahead of US GDP

The Aussie Dollar finished Wednesday’s session with decent gains of 0.15% against the US Dollar, yet it retreated from weekly highs of 0.6529, which it hit after a hotter-than-expected inflation report. As the Asian session begins, the AUD/USD trades around 0.6495.
USD/JPY finds its highest bids since 1990, approaches 156.00

USD/JPY broke into its highest chart territory since June of 1990 on Wednesday, peaking near 155.40 for the first time in 34 years as the Japanese Yen continues to tumble across the broad FX market.
Gold stays firm amid higher US yields as traders await US GDP data

Gold recovers from recent losses, buoyed by market interest despite a stronger US Dollar and higher US Treasury yields. De-escalation of Middle East tensions contributed to increased market stability, denting the appetite for Gold buying.
Ethereum suffers slight pullback, Hong Kong spot ETH ETFs to begin trading on April 30

Ethereum suffered a brief decline on Wednesday afternoon despite increased accumulation from whales. This follows Ethereum restaking protocol Renzo restaked ETH crashing from its 1:1 peg with ETH and increased activities surrounding spot Ethereum ETFs.
Dow Jones Industrial Average hesitates on Wednesday as markets wait for key US data

The DJIA stumbled on Wednesday, falling from recent highs near 38,550.00 as investors ease off of Tuesday’s risk appetite. The index recovered as US data continues to vex financial markets that remain overwhelmingly focused on rate cuts from the US Fed.