USD/CHF Price Forecast: Rallies capped below 100 and 200-day SMAs
- USD/CHF trades flat as US-Iran tensions keep markets cautious.
- US PMIs beat forecasts, hitting multi-month highs
- Technically, USD/CHF remains below key SMAs, keeping bearish bias intact.

USD/CHF trades flat on Thursday, with choppy price action and two-way swings as traders refrain from aggressive directional bets amid cautious market sentiment driven by ongoing US-Iran tensions. At the time of writing, the pair is trading around 0.7845.
Traders are closely monitoring developments in the US-Iran situation to assess whether negotiations will resume, as tensions escalate in the Strait of Hormuz. This is supporting the US Dollar despite some intraday weakness. The US Dollar Index (DXY), which tracks the Greenback’s value against a basket of six major currencies, is trading around 98.67 after hitting an intraday high of 98.80.
US President Donald Trump said on Truth Social that “we have total control over the Strait of Hormuz, no ship can enter or leave without the approval of the United States Navy.” He also added that he has ordered the Navy to “shoot and kill any boat” putting mines in Hormuz, stating that the route is “sealed up tight” until Iran is able to make a deal.
Meanwhile, traders are also digesting mixed US economic data. The preliminary S&P Global Manufacturing PMI rose to 54 in April, beating expectations and up from 52.3 in March, marking a 47-month high. The Services PMI also improved to 51.3, above forecasts of 50 and up from 49.8, reaching a two-month high, with both coming above expectations.
US Initial Jobless Claims rose to 214K in the week ending April 18, above the 212K forecast and up from 208K previously.
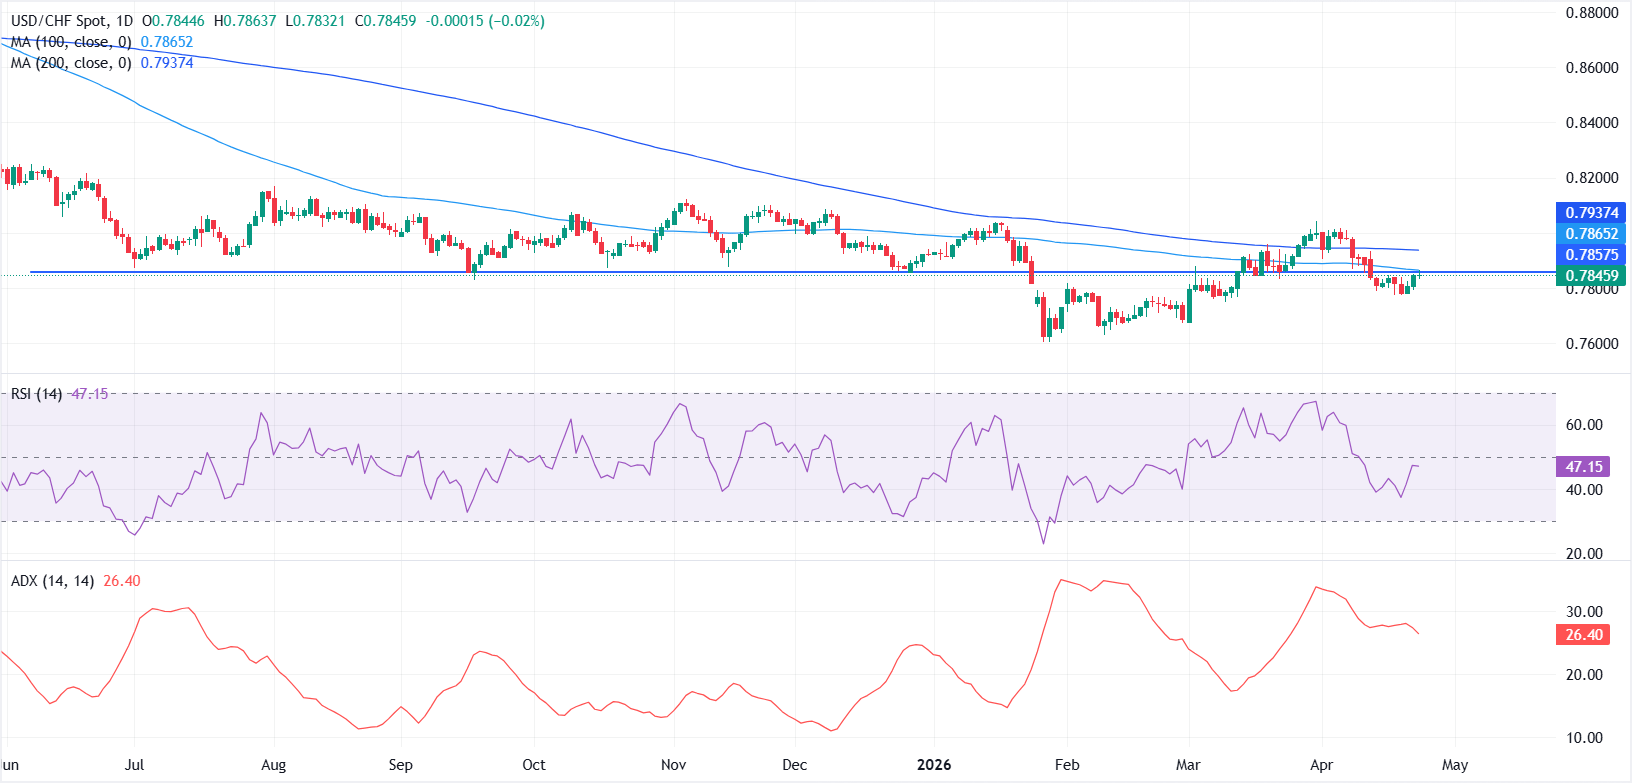
In the daily chart, USD/CHF keeps a bearish near-term bias as spot holds beneath both the 100-day simple moving average (SMA) at roughly 0.7865 and the 200-day SMA near 0.7937. The pair’s inability to reclaim these medium- and long-term averages hints that recent bounces are corrective within a broader downbeat structure. Meanwhile, the Relative Strength Index (RSI) has recovered from lows below 40 but remains below the midline, indicating momentum still leans to the downside, with the Average Directional Index (ADX) near 26 pointing to a moderately directional trend.
On the topside, initial resistance is aligned at the 100-day SMA at 0.7865, with a break higher exposing the more significant barrier at the 200-day SMA around 0.7937, where sellers would likely reassert control on first test. Until price establishes a sustained move above these moving averages, rallies are likely to be sold into, leaving the pair vulnerable to further downside exploration toward prior lows.
(The technical analysis of this story was written with the help of an AI tool.)
US Dollar FAQs
The US Dollar (USD) is the official currency of the United States of America, and the ‘de facto’ currency of a significant number of other countries where it is found in circulation alongside local notes. It is the most heavily traded currency in the world, accounting for over 88% of all global foreign exchange turnover, or an average of $6.6 trillion in transactions per day, according to data from 2022. Following the second world war, the USD took over from the British Pound as the world’s reserve currency. For most of its history, the US Dollar was backed by Gold, until the Bretton Woods Agreement in 1971 when the Gold Standard went away.
The most important single factor impacting on the value of the US Dollar is monetary policy, which is shaped by the Federal Reserve (Fed). The Fed has two mandates: to achieve price stability (control inflation) and foster full employment. Its primary tool to achieve these two goals is by adjusting interest rates. When prices are rising too quickly and inflation is above the Fed’s 2% target, the Fed will raise rates, which helps the USD value. When inflation falls below 2% or the Unemployment Rate is too high, the Fed may lower interest rates, which weighs on the Greenback.
In extreme situations, the Federal Reserve can also print more Dollars and enact quantitative easing (QE). QE is the process by which the Fed substantially increases the flow of credit in a stuck financial system. It is a non-standard policy measure used when credit has dried up because banks will not lend to each other (out of the fear of counterparty default). It is a last resort when simply lowering interest rates is unlikely to achieve the necessary result. It was the Fed’s weapon of choice to combat the credit crunch that occurred during the Great Financial Crisis in 2008. It involves the Fed printing more Dollars and using them to buy US government bonds predominantly from financial institutions. QE usually leads to a weaker US Dollar.
Quantitative tightening (QT) is the reverse process whereby the Federal Reserve stops buying bonds from financial institutions and does not reinvest the principal from the bonds it holds maturing in new purchases. It is usually positive for the US Dollar.
Author

Vishal Chaturvedi
FXStreet
I am a macro-focused research analyst with over four years of experience covering forex and commodities market. I enjoy breaking down complex economic trends and turning them into clear, actionable insights that help traders stay ahead of the curve.


