USD/CHF Price Forecast: US Dollar hits new YTD high past 0.8050
- USD/CHF clears the previous YTD high, confirming bullish continuation structure.
- RSI breaks latest peak, signaling buyers are gaining momentum.
- Break above 0.8100 exposes 0.8124 and 0.8171 resistance.

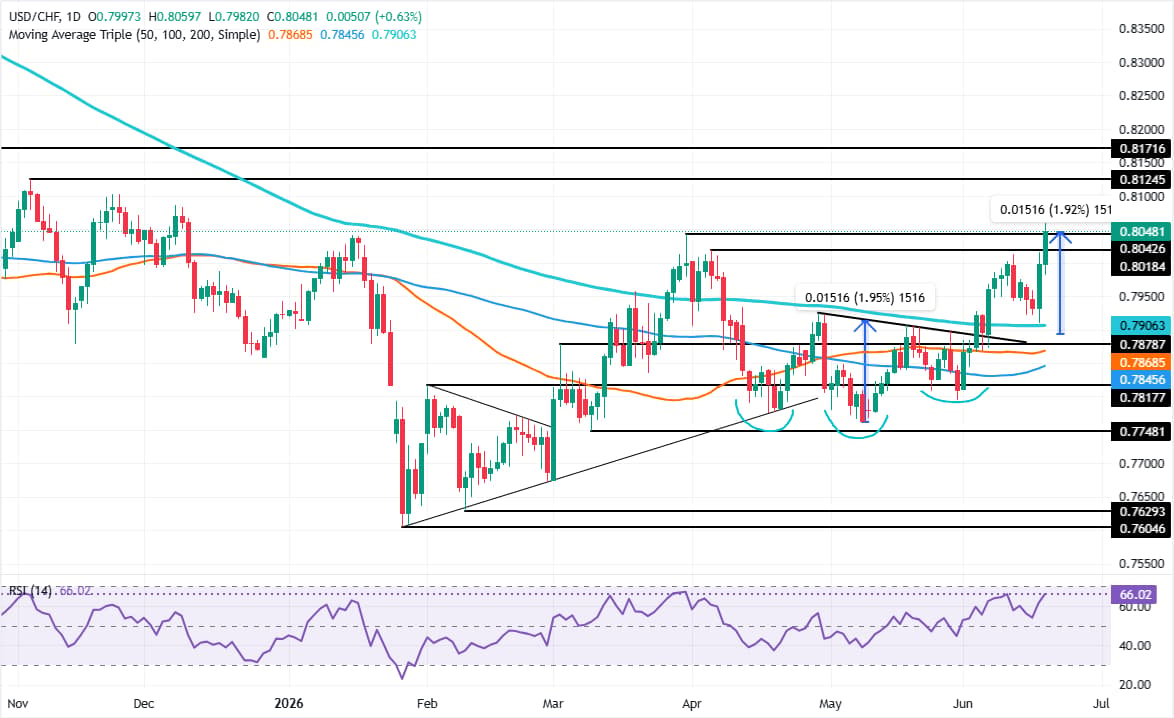
The USD/CHF pair rallies on Thursday to a new yearly high of 0.8059, surpassing March’s 31 previous peak of 2026 at 0.8042 as the Greenback stages a recovery amid hawkish Federal Reserve (Fed) policy expectations, which drove the pair to reach the ‘inverted head-and-shoulders’ price target.
USD/CHF Price Forecast: Technical outlook
Price action shows the pair is upwardly biased after clearing its previous yearly peak. USD/CHF buyers are shifting towards challenging the 0.8100 milestone, ahead of the November 2025 peak of 0.8124.
The Relative Strength Index (RSI) cleared its latest peak, signaling that buyers are gaining momentum.
Therefore, if USD/CHF clears 0.8100, the 0.8124 high is up next. Once breached, the next area of interest would be the August 2025 high at 0.8171, before buyers test the 0.8200 figure.
On the downside, the USD/CHF first support would be June’s 17 high, turned support at 0.8015. Once cleared, 0.8000 is up next, followed by the 200-day SMA at 0.7906.
USD/CHF Price Chart – Daily
Swiss Franc Price Today
The table below shows the percentage change of Swiss Franc (CHF) against listed major currencies today. Swiss Franc was the strongest against the British Pound.
| USD | EUR | GBP | JPY | CAD | AUD | NZD | CHF | |
|---|---|---|---|---|---|---|---|---|
| USD | 0.36% | 0.65% | 0.40% | 0.21% | -0.04% | 0.27% | 0.65% | |
| EUR | -0.36% | 0.30% | 0.07% | -0.15% | -0.41% | -0.14% | 0.29% | |
| GBP | -0.65% | -0.30% | -0.26% | -0.45% | -0.69% | -0.43% | -0.03% | |
| JPY | -0.40% | -0.07% | 0.26% | -0.19% | -0.47% | -0.20% | 0.21% | |
| CAD | -0.21% | 0.15% | 0.45% | 0.19% | -0.28% | -0.00% | 0.42% | |
| AUD | 0.04% | 0.41% | 0.69% | 0.47% | 0.28% | 0.27% | 0.71% | |
| NZD | -0.27% | 0.14% | 0.43% | 0.20% | 0.00% | -0.27% | 0.43% | |
| CHF | -0.65% | -0.29% | 0.03% | -0.21% | -0.42% | -0.71% | -0.43% |
The heat map shows percentage changes of major currencies against each other. The base currency is picked from the left column, while the quote currency is picked from the top row. For example, if you pick the Swiss Franc from the left column and move along the horizontal line to the US Dollar, the percentage change displayed in the box will represent CHF (base)/USD (quote).
(This story was corrected on June 18 at 20:21 GMT to say USD/CHF instead of USD/JPY in the technical analysis section.)
Author

Christian Borjon Valencia
FXStreet
Markets analyst, news editor, and trading instructor with over 14 years of experience across FX, commodities, US equity indices, and global macro markets.