USD/CHF Price Forecast: Breaks below key SMAs, eyes on 0.7800
- USD/CHF falls below all major SMAs, confirming bearish structure shift.
- RSI in bearish territory reflects strong selling pressure since April.
- Break below 0.7800 exposes 0.7775 and 0.7748 support levels.

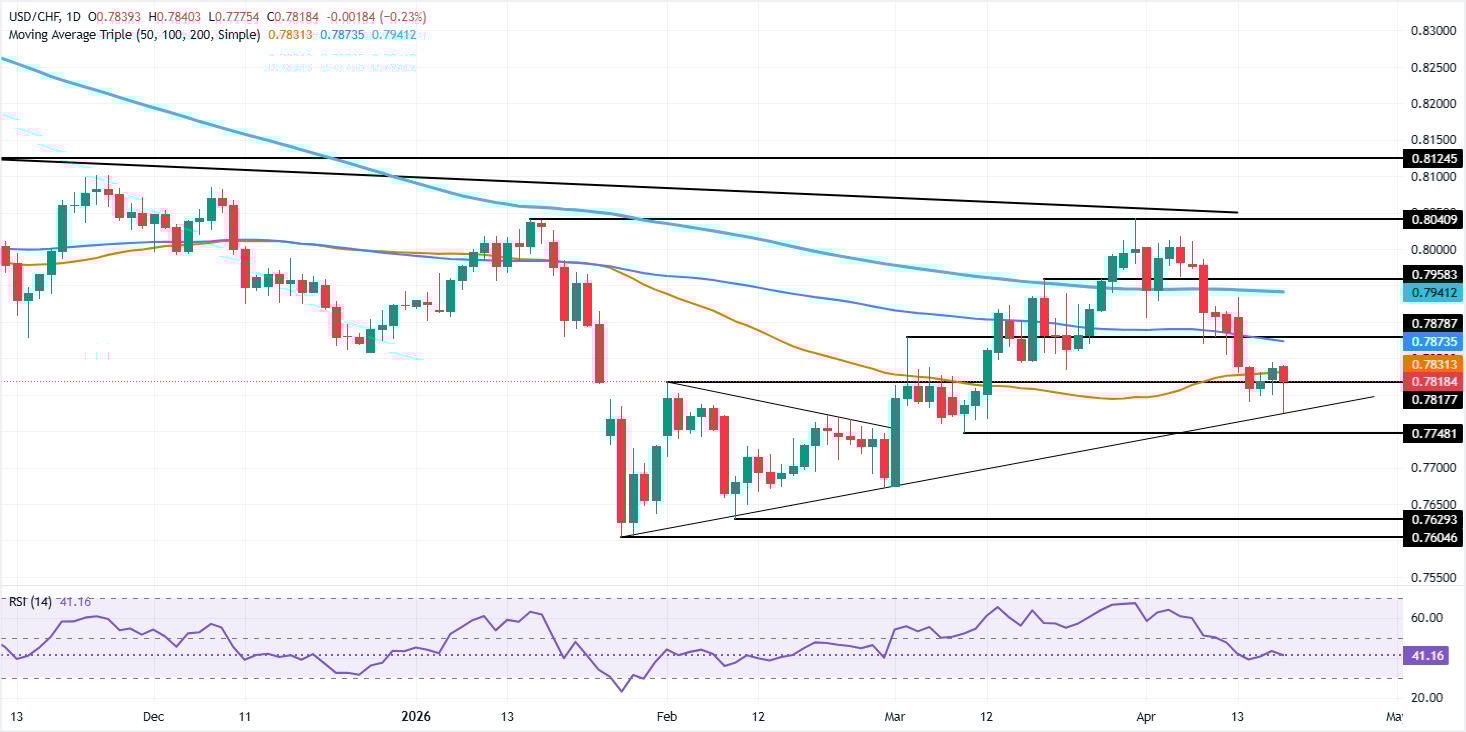
USD/CHF finishes the week on a lower note, down 0.87% for the week and 0.27% in the day, as markets turn optimistic about a possible US-Iran deal over the weekend. In the meantime, the technical picture remains bearish, as the pair tumbled below key moving averages, hitting a five-week low at 0.7775.
USD/CHF Price Forecast: Technical outlook
The daily chart shows the pair ended the day below the 50-day Simple Moving Average (SMA) at 0.7825—the last of a group of four that included the 20-, 100-, and 200-day SMAs —, opening the door for further downside. The Relative Strength Index (RSI) is also in bearish territory, indicating that bears have been aggressive since April 9, when the index pierced below its 50-neutral level.
For a bearish continuation, the USD/CHF must clear key support at 0.7800. A breach of the latter will expose a key support trendline around 0.7775/80, followed by the March 10 daily low at 0.7748. Fresh buying interest is seen at 0.7700.
On the other hand, a break of resistance at the 50-day SMA would expose the 100-day SMA at 0.7871, ahead of the 20-day SMA at 0.7909. Overhead lies the 200-day SMA at 0.7937.
USD/CHF Price Chart – Daily
Swiss Franc Price This week
The table below shows the percentage change of Swiss Franc (CHF) against listed major currencies this week. Swiss Franc was the strongest against the US Dollar.
| USD | EUR | GBP | JPY | CAD | AUD | NZD | CHF | |
|---|---|---|---|---|---|---|---|---|
| USD | -0.78% | -0.92% | -0.59% | -1.23% | -2.48% | -1.43% | -1.14% | |
| EUR | 0.78% | -0.15% | 0.17% | -0.43% | -1.65% | -0.66% | -0.34% | |
| GBP | 0.92% | 0.15% | 0.26% | -0.30% | -1.50% | -0.51% | -0.18% | |
| JPY | 0.59% | -0.17% | -0.26% | -0.66% | -1.84% | -0.74% | -0.57% | |
| CAD | 1.23% | 0.43% | 0.30% | 0.66% | -1.10% | -0.09% | 0.11% | |
| AUD | 2.48% | 1.65% | 1.50% | 1.84% | 1.10% | 1.06% | 1.27% | |
| NZD | 1.43% | 0.66% | 0.51% | 0.74% | 0.09% | -1.06% | 0.31% | |
| CHF | 1.14% | 0.34% | 0.18% | 0.57% | -0.11% | -1.27% | -0.31% |
The heat map shows percentage changes of major currencies against each other. The base currency is picked from the left column, while the quote currency is picked from the top row. For example, if you pick the Swiss Franc from the left column and move along the horizontal line to the US Dollar, the percentage change displayed in the box will represent CHF (base)/USD (quote).
Author

Christian Borjon Valencia
FXStreet
Markets analyst, news editor, and trading instructor with over 14 years of experience across FX, commodities, US equity indices, and global macro markets.
















