USD/CHF Price Forecast: Bearish flag forms as bulls eye 0.8200
- USD/CHF refreshes ten-day highs as uptrend remains intact.
- Bearish flag warns of retracement below 50-day SMA.
- Break above the flag targets 0.8200 and the yearly peak.
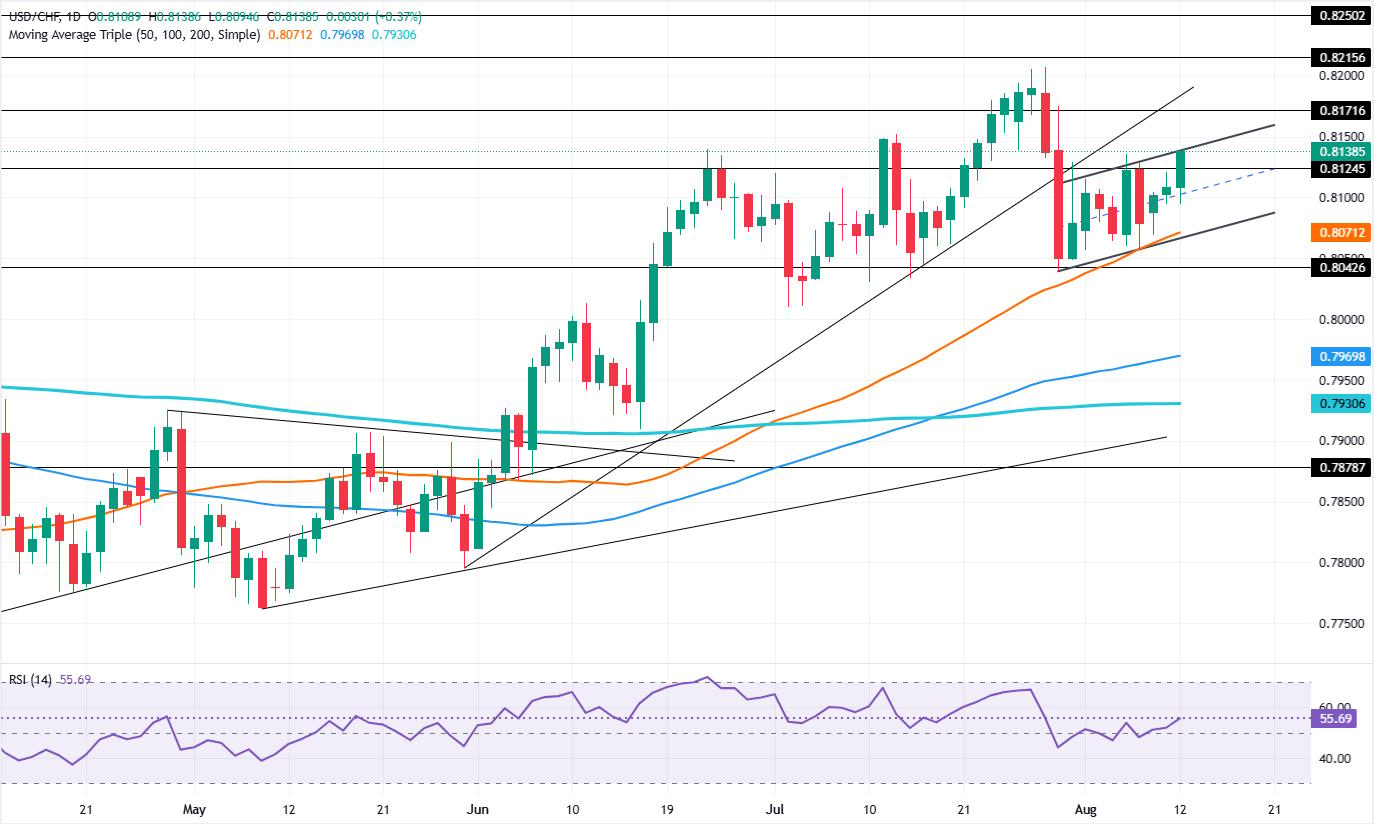
The USD/CHF pair edges higher by some 0.30% on Wednesday, refreshing ten-day highs of 0.8138, as the uptrend is poised to extend if it clears key resistance levels.
USD/CHF Price Forecast: Technical outlook
The market structure of successive higher highs and higher lows continues to be respected, indicating that the uptrend remains in place. Nevertheless, it seems that a bearish flag is forming, which could open the door for a deeper pullback before USD/CHF resumes its uptrend.
Momentum remains bullish as depicted by the Relative Strength Index (RSI). But if USD/CHF falls below the 50-day Simple Moving Average (SMA) at 0.8071, it opens the door to a retracement, initially to 0.8042, ahead of 0.8000.
Conversely, if the pair surpasses the top trendline of the bearish flag, this clears the way towards 0.8200 and the yearly peak at 0.8205. Once those two levels are removed, buyers could challenge the psychological levels of 0.8250 and 0.8300.
USD/CHF Price Chart – Daily
Swiss Franc Price Today
The table below shows the percentage change of Swiss Franc (CHF) against listed major currencies today. Swiss Franc was the strongest against the New Zealand Dollar.
| USD | EUR | GBP | JPY | CAD | AUD | NZD | CHF | |
|---|---|---|---|---|---|---|---|---|
| USD | 0.17% | 0.13% | 0.13% | 0.16% | 0.02% | 0.39% | 0.36% | |
| EUR | -0.17% | -0.04% | -0.06% | -0.02% | -0.19% | 0.24% | 0.19% | |
| GBP | -0.13% | 0.04% | -0.02% | 0.00% | -0.15% | 0.26% | 0.23% | |
| JPY | -0.13% | 0.06% | 0.02% | 0.02% | -0.12% | 0.28% | 0.24% | |
| CAD | -0.16% | 0.02% | -0.01% | -0.02% | -0.15% | 0.27% | 0.21% | |
| AUD | -0.02% | 0.19% | 0.15% | 0.12% | 0.15% | 0.39% | 0.38% | |
| NZD | -0.39% | -0.24% | -0.26% | -0.28% | -0.27% | -0.39% | -0.05% | |
| CHF | -0.36% | -0.19% | -0.23% | -0.24% | -0.21% | -0.38% | 0.05% |
The heat map shows percentage changes of major currencies against each other. The base currency is picked from the left column, while the quote currency is picked from the top row. For example, if you pick the Swiss Franc from the left column and move along the horizontal line to the US Dollar, the percentage change displayed in the box will represent CHF (base)/USD (quote).
Author

Christian Borjon Valencia
FXStreet
Markets analyst, news editor, and trading instructor with over 14 years of experience across FX, commodities, US equity indices, and global macro markets.















