USD/CAD Price Forecast: Neutral RSI and soft ADX signal lack of momentum
- USD/CAD holds firm as opposing pressure from the US Dollar and Oil prices keeps price action range-bound.
- Fading hopes for a US-Iran peace deal continue to keep geopolitical tensions elevated.
- Technically, the pair lacks bullish conviction while trading below the 100-day and 200-day SMAs on the daily chart.

USD/CAD fluctuates between minor gains and losses on Monday as the pair faces opposing pressure from a steady US Dollar (USD) and elevated Oil prices. At the time of writing, USD/CAD is trading nearly flat around 1.3672.
Earlier hopes for a near-term end to the US-Iran war faded after US President Donald Trump told reporters in the Oval Office on Monday that he would meet with his national security team to discuss the conflict and possible military options to pressure Iran into reaching a deal.
The comments came after Trump rejected Iran’s latest response to the US-backed peace proposal, calling it “totally unacceptable” in a Truth Social post on Sunday.
The lingering uncertainty surrounding a potential peace agreement is keeping a floor under the US Dollar, while ongoing disruptions to supply flows through the Strait of Hormuz continue to keep Oil prices elevated.
The Canadian Dollar (CAD) remains particularly sensitive to movements in Oil prices, given Canada’s status as a major crude exporter. Elevated energy prices tend to support the commodity-linked Loonie and help limit upside in USD/CAD, while technical indicators suggest the pair remains stuck in a weak consolidation phase.
Technical Analysis:
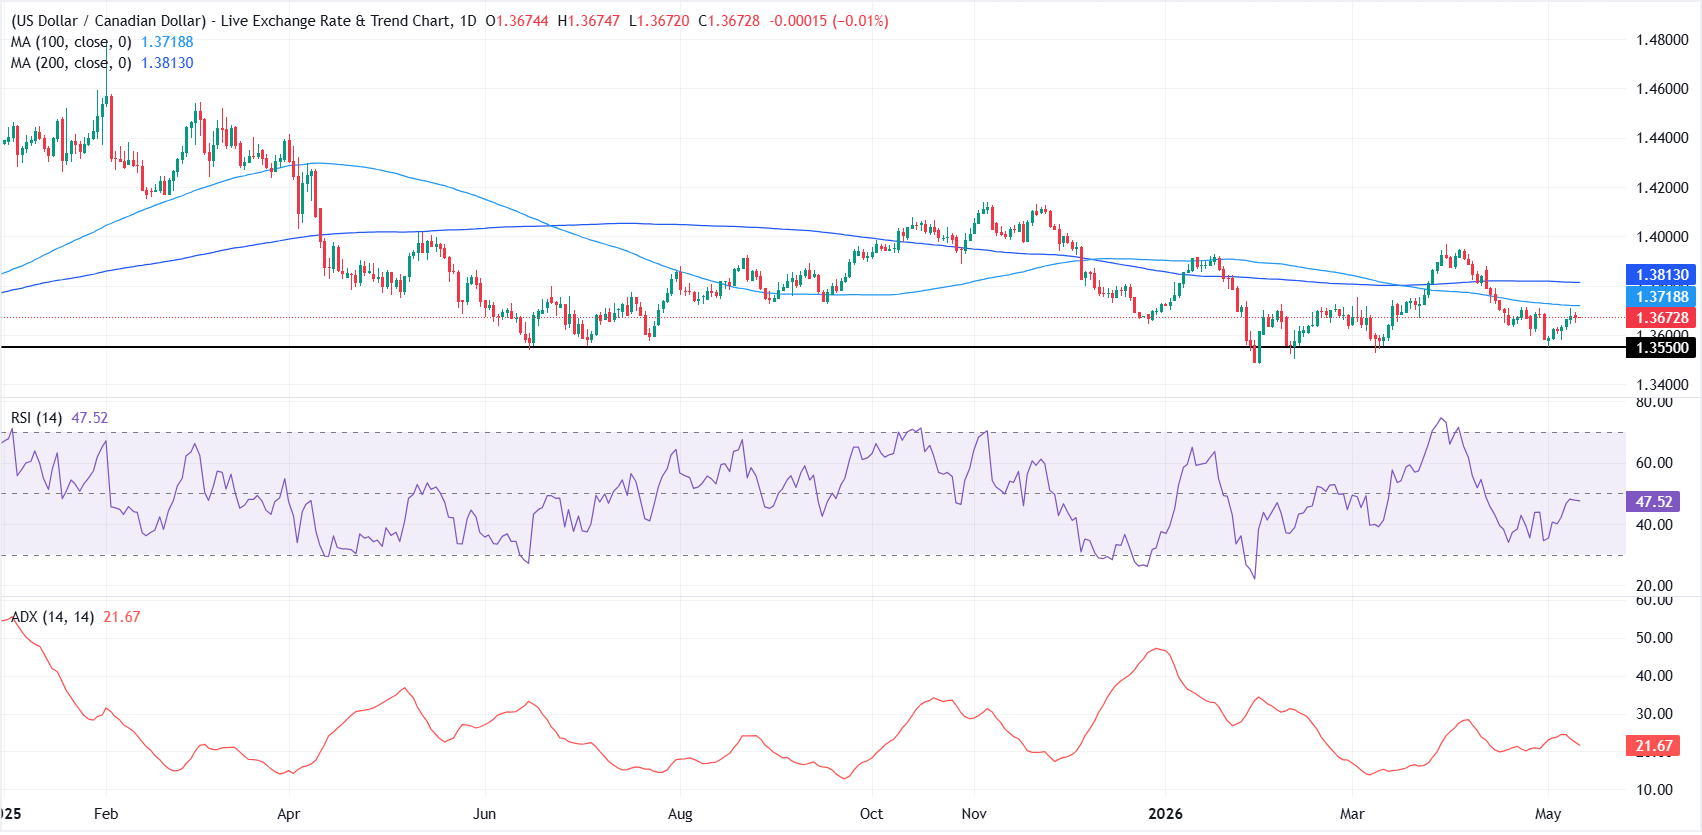
On the daily chart, USD/CAD is holding below both the 100-day Simple Moving Average (SMA) at 1.3719 and the 200-day SMA at 1.3813, which keeps the broader tone capped after the recent pullback from April highs. The Relative Strength Index (RSI) at around 48 is neutral and the Average Directional Index (ADX) near 22 signals only modest trend strength, suggesting consolidation rather than an impulsive move while price remains under these key moving averages.
On the topside, initial resistance is aligned at the 100-day SMA at 1.3719, with the 200-day SMA at 1.3813 acting as the next barrier if buyers attempt a recovery. On the downside, the first notable support sits at the horizontal level near 1.3550, where a break lower would expose a deeper corrective phase, while holding above this floor would keep the pair confined to a broad range beneath the daily moving average cluster.
(The technical analysis of this story was written with the help of an AI tool.)
US Dollar Price Today
The table below shows the percentage change of US Dollar (USD) against listed major currencies today. US Dollar was the strongest against the Japanese Yen.
| USD | EUR | GBP | JPY | CAD | AUD | NZD | CHF | |
|---|---|---|---|---|---|---|---|---|
| USD | 0.09% | 0.02% | 0.33% | -0.03% | -0.07% | 0.08% | 0.22% | |
| EUR | -0.09% | -0.07% | 0.22% | -0.15% | -0.15% | -0.01% | 0.13% | |
| GBP | -0.02% | 0.07% | 0.30% | -0.07% | -0.09% | 0.06% | 0.19% | |
| JPY | -0.33% | -0.22% | -0.30% | -0.36% | -0.36% | -0.24% | -0.11% | |
| CAD | 0.03% | 0.15% | 0.07% | 0.36% | -0.00% | 0.08% | 0.25% | |
| AUD | 0.07% | 0.15% | 0.09% | 0.36% | 0.00% | 0.13% | 0.27% | |
| NZD | -0.08% | 0.00% | -0.06% | 0.24% | -0.08% | -0.13% | 0.16% | |
| CHF | -0.22% | -0.13% | -0.19% | 0.11% | -0.25% | -0.27% | -0.16% |
The heat map shows percentage changes of major currencies against each other. The base currency is picked from the left column, while the quote currency is picked from the top row. For example, if you pick the US Dollar from the left column and move along the horizontal line to the Japanese Yen, the percentage change displayed in the box will represent USD (base)/JPY (quote).
Author

Vishal Chaturvedi
FXStreet
I am a macro-focused research analyst with over four years of experience covering forex and commodities market. I enjoy breaking down complex economic trends and turning them into clear, actionable insights that help traders stay ahead of the curve.















