USD/CAD Price Forecast: Bulls retain the upper hand above 1.4000 despite overbought RSI
- USD/CAD climbs to its highest level since April 2025 as a stronger US Dollar and weaker Oil prices weigh on the Canadian Dollar.
- Hawkish Federal Reserve expectations contrast with the Bank of Canada's steady policy stance.
- Technically, USD/CAD remains firmly bullish, though an overbought RSI suggests upside may be becoming overstretched.

USD/CAD climbs to fresh highs since April 2025 on Wednesday as the Canadian Dollar (CAD) faces a double blow from a stronger US Dollar (USD) and weaker Oil prices.
At the time of writing, the pair trades around 1.4235. Meanwhile, the US Dollar Index (DXY), which tracks the Greenback's value against a basket of six major currencies, is trading around 101.64, a level last seen in May 2025.
The US Dollar is drawing support from rising expectations that the Federal Reserve (Fed) could raise interest rates later this year after Chair Kevin Warsh struck a hawkish tone at last week's monetary policy meeting. Warsh reiterated the central bank's commitment to restoring price stability and bringing inflation back to its 2% target.
The hawkish Fed outlook diverges from the Bank of Canada's (BoC) steady policy stance, suggesting USD/CAD is likely to remain supported in the near term.
At the same time, Oil prices have retraced almost all of their US-Iran war-driven gains amid the gradual reopening of the Strait of Hormuz following last week's 60-day memorandum of understanding. West Texas Intermediate (WTI) trades around $70.35, its lowest level since early March.
The decline in Oil prices is adding pressure on the commodity-linked Loonie, given Canada's status as a major crude exporter.
Technical Analysis:
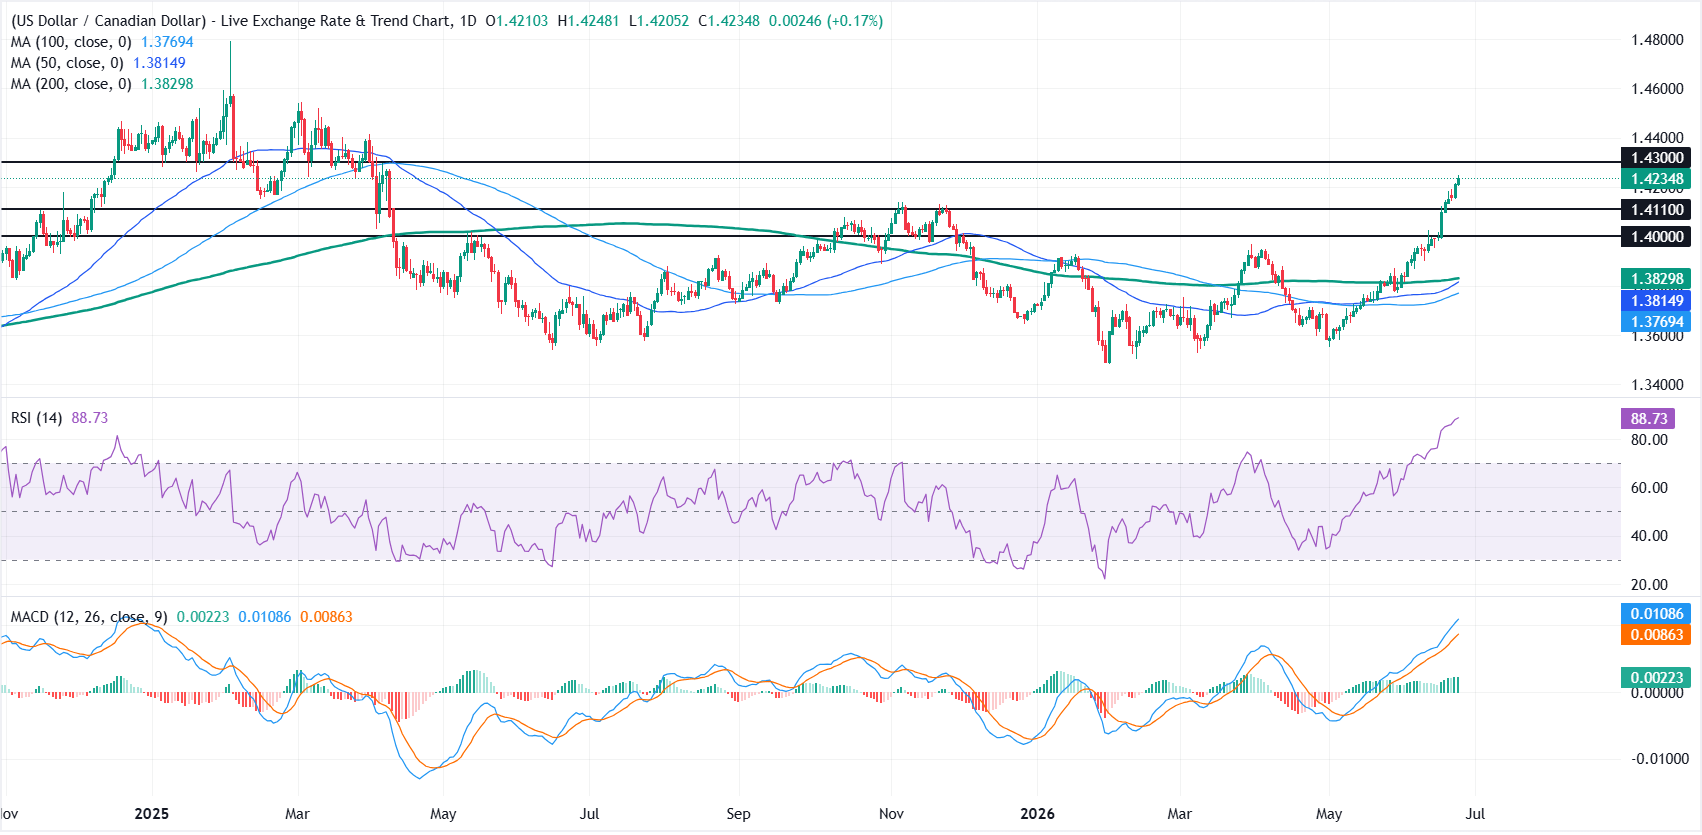
In the daily chart, USD/CAD is extending a strong bullish phase while holding well above the 50-, 100- and 200-day Simple Moving Averages (SMAs) clustered between 1.3769 and 1.3830.
The Moving Average Convergence Divergence (MACD) histogram remains positive and elevated, hinting that upside momentum is still in play, but the Relative Strength Index (RSI) at 88 signals extreme overbought conditions, suggesting that the advance could be vulnerable to a corrective pullback even as the broader trend stays constructive.
On the downside, initial support emerges at 1.4110, followed by the 1.4000 horizontal level before the longer-term SMA band around 1.3830-1.3770 comes into view.
On the topside, immediate resistance is located at 1.4300, where a clear break higher would open the door to further gains, while failure to overcome this barrier would increase the risk of a consolidation or deeper retracement toward the cited supports.
(The technical analysis of this story was written with the help of an AI tool.)
Fed FAQs
Monetary policy in the US is shaped by the Federal Reserve (Fed). The Fed has two mandates: to achieve price stability and foster full employment. Its primary tool to achieve these goals is by adjusting interest rates. When prices are rising too quickly and inflation is above the Fed’s 2% target, it raises interest rates, increasing borrowing costs throughout the economy. This results in a stronger US Dollar (USD) as it makes the US a more attractive place for international investors to park their money. When inflation falls below 2% or the Unemployment Rate is too high, the Fed may lower interest rates to encourage borrowing, which weighs on the Greenback.
The Federal Reserve (Fed) holds eight policy meetings a year, where the Federal Open Market Committee (FOMC) assesses economic conditions and makes monetary policy decisions. The FOMC is attended by twelve Fed officials – the seven members of the Board of Governors, the president of the Federal Reserve Bank of New York, and four of the remaining eleven regional Reserve Bank presidents, who serve one-year terms on a rotating basis.
In extreme situations, the Federal Reserve may resort to a policy named Quantitative Easing (QE). QE is the process by which the Fed substantially increases the flow of credit in a stuck financial system. It is a non-standard policy measure used during crises or when inflation is extremely low. It was the Fed’s weapon of choice during the Great Financial Crisis in 2008. It involves the Fed printing more Dollars and using them to buy high grade bonds from financial institutions. QE usually weakens the US Dollar.
Quantitative tightening (QT) is the reverse process of QE, whereby the Federal Reserve stops buying bonds from financial institutions and does not reinvest the principal from the bonds it holds maturing, to purchase new bonds. It is usually positive for the value of the US Dollar.
Author

Vishal Chaturvedi
FXStreet
I am a macro-focused research analyst with over four years of experience covering forex and commodities market. I enjoy breaking down complex economic trends and turning them into clear, actionable insights that help traders stay ahead of the curve.