|

USD/CAD Price Analysis: Struggles at 1.3300 but holds to gains, amid bearish technical pattern

  • USD/CAD forms a bearish engulfing pattern and struggles to breach the 1.3300 mark, signaling a possible downside.
  • Pair is currently neutral but might dip further with key support at the 20-day EMA and potentially slide to YTD low.
  • If 1.3300 is reclaimed, USD/CAD may challenge the 50-day EMA before tackling significant resistance at 200 EMA and 1.3400.

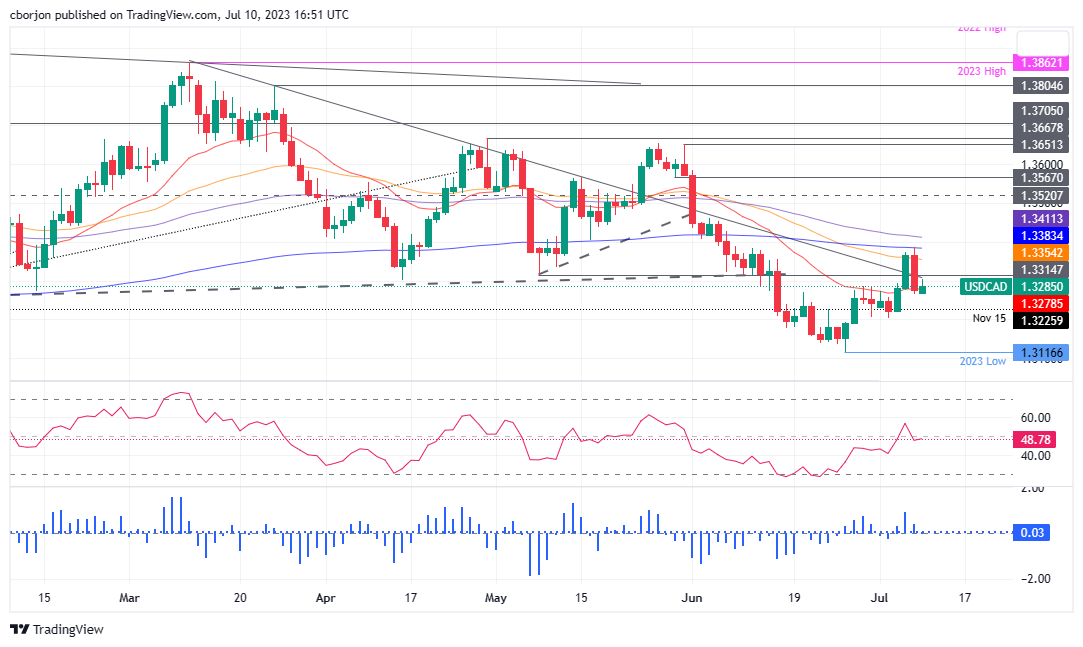
USD/CAD bounces off the 20-day Exponential Moving Average (EMA) at 1.3278 after forming a bearish engulfing candlestick pattern, which suggests further downside is expected. Nevertheless, dynamic support spurred a jump in the USD/CAD exchange rates but fell short of cracking the 1.3300 figure. At the time of writing, the USD/CAD is trading at 1.3286 after hitting a daily high of 1.3304.

USD/CAD Price Analysis: Technical outlook

The USD/CAD remains neutral biased, capped on the upside by strong resistance levels, like the 50, 200, and 100-day EMAs, each at 1.3354, 1.3383, and 1.3411, respectively. Additionally, a bearish engulfing candle pattern suggests the pair might dip lower, with the 20-day EMA being the first support at 1.3278.

A breach of the latter will expose July’s 4 daily low of 1.3203. once cleared, the USD/CAD could extend its slide to the year-to-date (YTD) low of 1.3116.

Conversely, if USD/CAD reclaims 1.3300, the 50-day EMA at 1.3354 would be up for grabs. Next, resistance levels would emerge at the 200 EMA before buyers challenge 1.3400. Once broken, the USD/CAD could test the 100-day EMA at 1.3411.

USD/CAD Price Action – Daily chart
USD/CAD Daily chart

USD/CAD

Overview
Today last price1.3287
Today Daily Change0.0014
Today Daily Change %0.11
Today daily open1.3273
 
Trends
Daily SMA201.3244
Daily SMA501.3392
Daily SMA1001.3489
Daily SMA2001.3503
 
Levels
Previous Daily High1.3387
Previous Daily Low1.3266
Previous Weekly High1.3387
Previous Weekly Low1.3203
Previous Monthly High1.3585
Previous Monthly Low1.3117
Daily Fibonacci 38.2%1.3312
Daily Fibonacci 61.8%1.3341
Daily Pivot Point S11.323
Daily Pivot Point S21.3188
Daily Pivot Point S31.3109
Daily Pivot Point R11.3351
Daily Pivot Point R21.343
Daily Pivot Point R31.3472

Author

Christian Borjon Valencia

Markets analyst, news editor, and trading instructor with over 14 years of experience across FX, commodities, US equity indices, and global macro markets.


More from Christian Borjon Valencia
Share:

Editor's Picks

AUD/USD keeps the red near 0.6950 after weak Aussie jobs data

AUD/USD holds losses near 0.6950 on disappointing Australian jobs data, extending the previous day's retracement slide from the monthly high and hitting a fresh weekly low during Thursday’s Asian session. Meanwhile, declining US bond yields drag the US Dollar away from the April 2025 high, touched after Wednesday's hot US CPI, helping limit losses for the currency pair.

USD/JPY slides back below 158.00 as USD reverses post-CPI gains

USD/JPY extends the previous day's pullback from a three-week high, attracting follow-through selling and sliding below 158.00 during Thursday's Asian session. Traders remain on high alert amid speculation that authorities will step in to prop up the Japanese Yen. The US Dollar, meanwhile, reverses Wednesday's hot CPI-led gains to April 2025 highs as US bond yields retreat on China bond-buying talk, further pressuring the pair.

Gold rebounds firmly as China Treasuries-buying report smashes US yields

Gold stages a solid comeback from weekly lows, retakes $4,150 early Thursday. US Dollar declines sharply alongside Treasury yields on China’s bond-buying report. Technically, the daily RSI remains bearish and a headwind for Gold buyers.

Zcash declines as US inflation surprise offsets fresh ETF inflows
Zcash (ZEC) is trading in the red on Friday, extending its previous day’s roughly 6% losses as the broader cryptocurrency market falls on rising US inflation. The US Consumer Price Index (CPI) print came in higher than expected, at an annual increase of 3.7% versus the expected 3.6%, raising concerns about inflation and rate hikes.
China seems routing US Treasury holdings through Canada

According to a Bloomberg report, China seems to be moving United States securities to non-US custodian banks in other countries, masking its role in financing US deficits.

Has Bitcoin really escaped the macro forces it was built to fight?
Over 17 years ago, Satoshi Nakamoto designed Bitcoin (BTC) on the back of a global financial crisis as an alternative to the global monetary system outside the control of central banks, governments and traditional intermediaries. This raises a key question: has Bitcoin really become independent of the macroeconomic forces it was built to challenge?