|

USD/CAD jumps above the 1.3370 zone amid strong US Dollar

  • USD/CAD jumped to a daily high of 1.3384 following four days of losses.
  • Strong Dollar and falling Oil prices weigh on the CAD.
  • All eyes are on Tuesday’s inflation data from the US.

During Monday’s session, the USD/CAD cut a four-day losing streak jumping to a daily high of 1.3384 as the US Dollar held its footing ahead of an eventful week. On the other hand, the Lonnie seems to be suffering from the plunge in Oil prices which have seen losses of more than 3% on the day.

Attention shifts to CPI data and Fed decision

Markets seem to be awaiting the upcoming release of the US Consumer Price Index (CPI) data for May to define direction. It is anticipated that the headline figure will show a slowdown to a year-on-year (YoY) rate of 4.1%, while the Core measure is expected to decline from the previous 5.5% YoY to 5.3%.

In addition, the CME FedWatch Tool, currently suggests a 25% chance of an interest rate hike for the upcoming Wednesday’s Federal Reserve (Fed) decision. Moreover, rate cuts are no longer anticipated by the end of the year, so market participants will keep an eye on Fed Chair Powell’s presser on Wednesday looking for clues regarding forward guidance

On the Canadian side, the CAD bulls seem to have taken a step back and are consolidating gains from last week’s Bank of Canada (BoC) surprising 25 basis point (bps) hike. Moreover, the Loonie seems to be facing further weakness amid Oil’s heavy losses as the WTI (Western Texas Intermediate) is down by 3.60% on the day, trading at the $67.45 level.

USD/CAD levels to watch

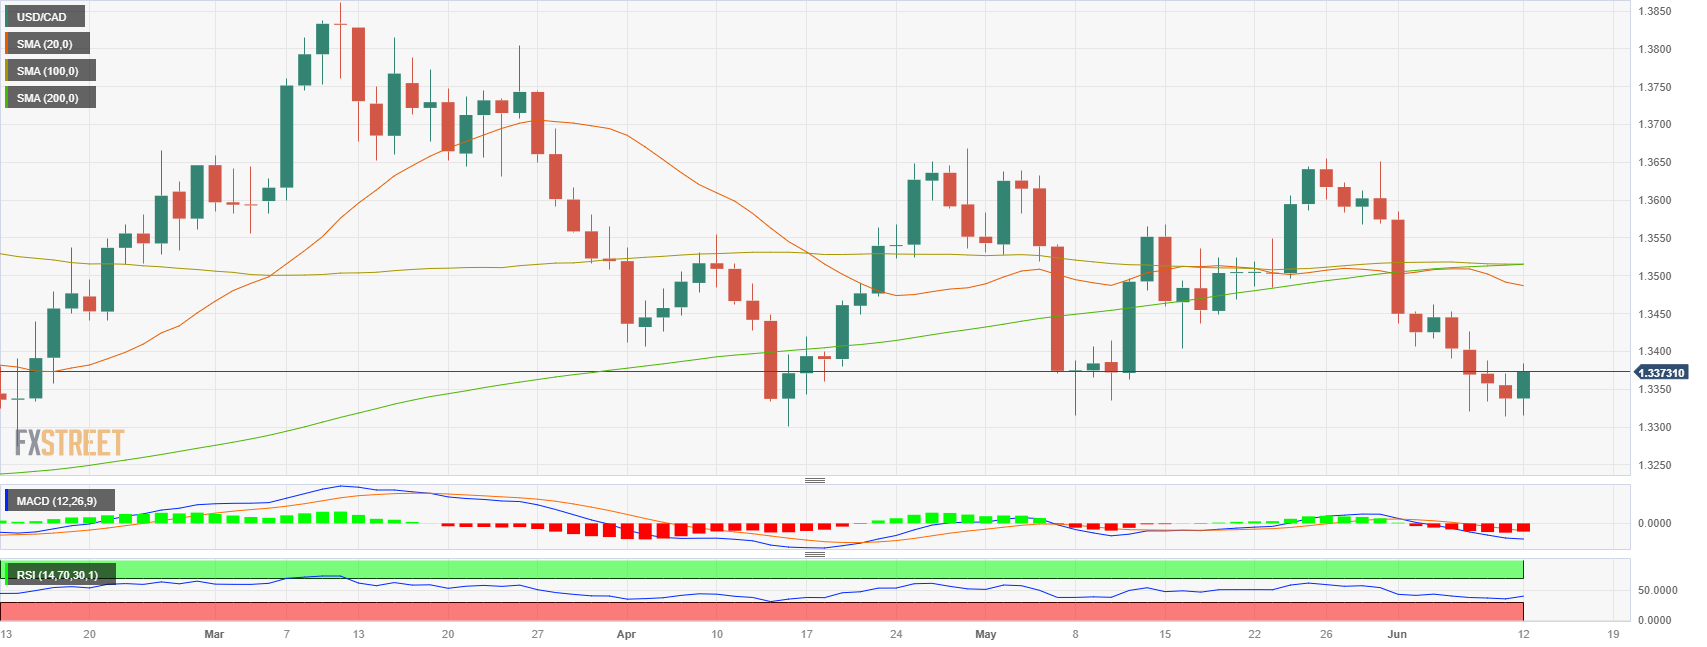
According to the daily chart, the USD/CAD shows a neutral to bearish perspective for the short term. Despite indicators having gained some traction, they are still operating in negative territory. The Relative Strength Index (RSI) sits below its midline but exhibits a positive slope. while, the Moving Average Convergence Divergence (MACD) printed a decreasing red bar, indicating diminishing selling momentum.

The 1.3350 zone level is key for USD/CAD to maintain its upside bias. If breached, the price could see a steeper decline towards the 1.3310 area and towards the multi-month low at 1.3300. Furthermore, upcoming resistance for USD/CAD is seen at the zone at 1.3380 level, followed by the psychological mark at 1.3400 and the 1.3450 area.

USD/CAD daily chart

USD/CAD

Overview
Today last price1.3374
Today Daily Change0.0036
Today Daily Change %0.27
Today daily open1.3338
 
Trends
Daily SMA201.3492
Daily SMA501.3488
Daily SMA1001.3515
Daily SMA2001.3514
 
Levels
Previous Daily High1.3371
Previous Daily Low1.3313
Previous Weekly High1.3462
Previous Weekly Low1.3313
Previous Monthly High1.3655
Previous Monthly Low1.3315
Daily Fibonacci 38.2%1.3335
Daily Fibonacci 61.8%1.3349
Daily Pivot Point S11.331
Daily Pivot Point S21.3283
Daily Pivot Point S31.3252
Daily Pivot Point R11.3368
Daily Pivot Point R21.3399
Daily Pivot Point R31.3426

Author

Patricio Martín

Patricio is an economist from Argentina passionate about global finance and understanding the daily movements of the markets.

More from Patricio Martín
Share:

Editor's Picks

GBP/USD loses momentum, flirts with 1.3200

GBP/USD is struggling to maintain its positive bias on Thursday, retreating toward the 1.3200 region in response to the pick in the buying interest around the Greenback. That said, Cable remains under scrutiny as cautious market sentiment keeps investors focused on the US-Iran conflict and political effervescence in the UK.

EUR/USD trims gains, challenges 1.1400

EUR/USD now gives away part of its earlier advance, receding toward the 1.1400 contention zone on Thursday. Meanwhile, the pair’s recovery comes amid extra losses in the US Dollar, at the time when while investors continue to monitor developments in the Middle East and sentiment surrounding global technology stocks.

Gold remains bid and close to $4,100

Gold accelerates its recovery and approaches the key $4,000 mark per troy ounce at the end of the week, adding to Thursday’s advance. However, expectations for a hawkish Fed remain steady and keep the yellow metal’s potential upside contained.

Crypto Today: Bitcoin at $60,000, Ethereum at $1,500, and XRP at $1 face a make-or-break test

Bitcoin (BTC), Ethereum (ETH), and Ripple (XRP) are trading in the red on Friday after three consecutive days of losses, testing their respective make-or-break support levels.

Week ahead – NFP report to challenge Dollar strength and the hawkish Fed

Dollar strength dominates markets, as the hawkish Fed overshadows geopolitics and lower oil prices. NFP week could drive September Fed hike expectations and boost market volatility. The euro lacks fresh bullish catalysts, all eyes on the preliminary inflation report and the ECB Forum.

Regime change: Inside Kevin Warsh's first move to make the Fed unreadable on purpose

The rate did not move. That was the least interesting thing about Kevin Warsh's first meeting in charge of the Fed. The FOMC held its benchmark at 3.50%-3.75% for the fourth straight meeting, exactly as priced, and then the new chair used his first press conference to dismantle the machinery the market has leaned on for a decade.