US Dollar Index Price Forecast: Sticks to gains near 101.35 as bulls await Fed's Warsh
- USD Index gains some positive traction amid geopolitical uncertainty and Fed rate-hike bets.
- The recent breakout above the 100.50 barrier favors bulls and backs the case for further gains.
- Any corrective pullback is likely to find decent support and be bought into near the 100.58 pivot.
The US Dollar Index (DXY), which tracks the Greenback against a basket of currencies, attracts fresh buyers on Wednesday amid uncertainty over Middle East diplomacy and elevated expectations of US Federal Reserve (Fed) rate hikes. The Index sticks to modest intraday gains around the 101.35 region through the first half of the European session as traders await Fed Chair Kevin Warsh's speech for fresh policy cues and some meaningful impetus.
Looking at the broader picture, the recent breakout through the 100.50 horizontal barrier on the daily chart was seen as a fresh trigger for the US Dollar (USD) bulls. Meanwhile, the Relative Strength Index at 67.38 stays in bullish territory, though it remains close to overbought conditions. However, the positive Moving Average Convergence Divergence (MACD) reading around 0.04 suggests that buyers retain control, even if upside progress could slow as momentum becomes stretched.
DXY daily chart
On the 4-hour chart, the DXY seems to have formed a short-term base around the 101.00 round figure and retains a short-term bullish bias above the 100-period Simple Moving Average (SMA) near 100.59. The latter should act as an immediate pivot for near-term direction. As long as the index defends these levels on a closing basis, dips are likely to be absorbed by buyers, with the path of least resistance pointing to further stabilization and potential grinding gains in the short term.
DXY 4-hour chart
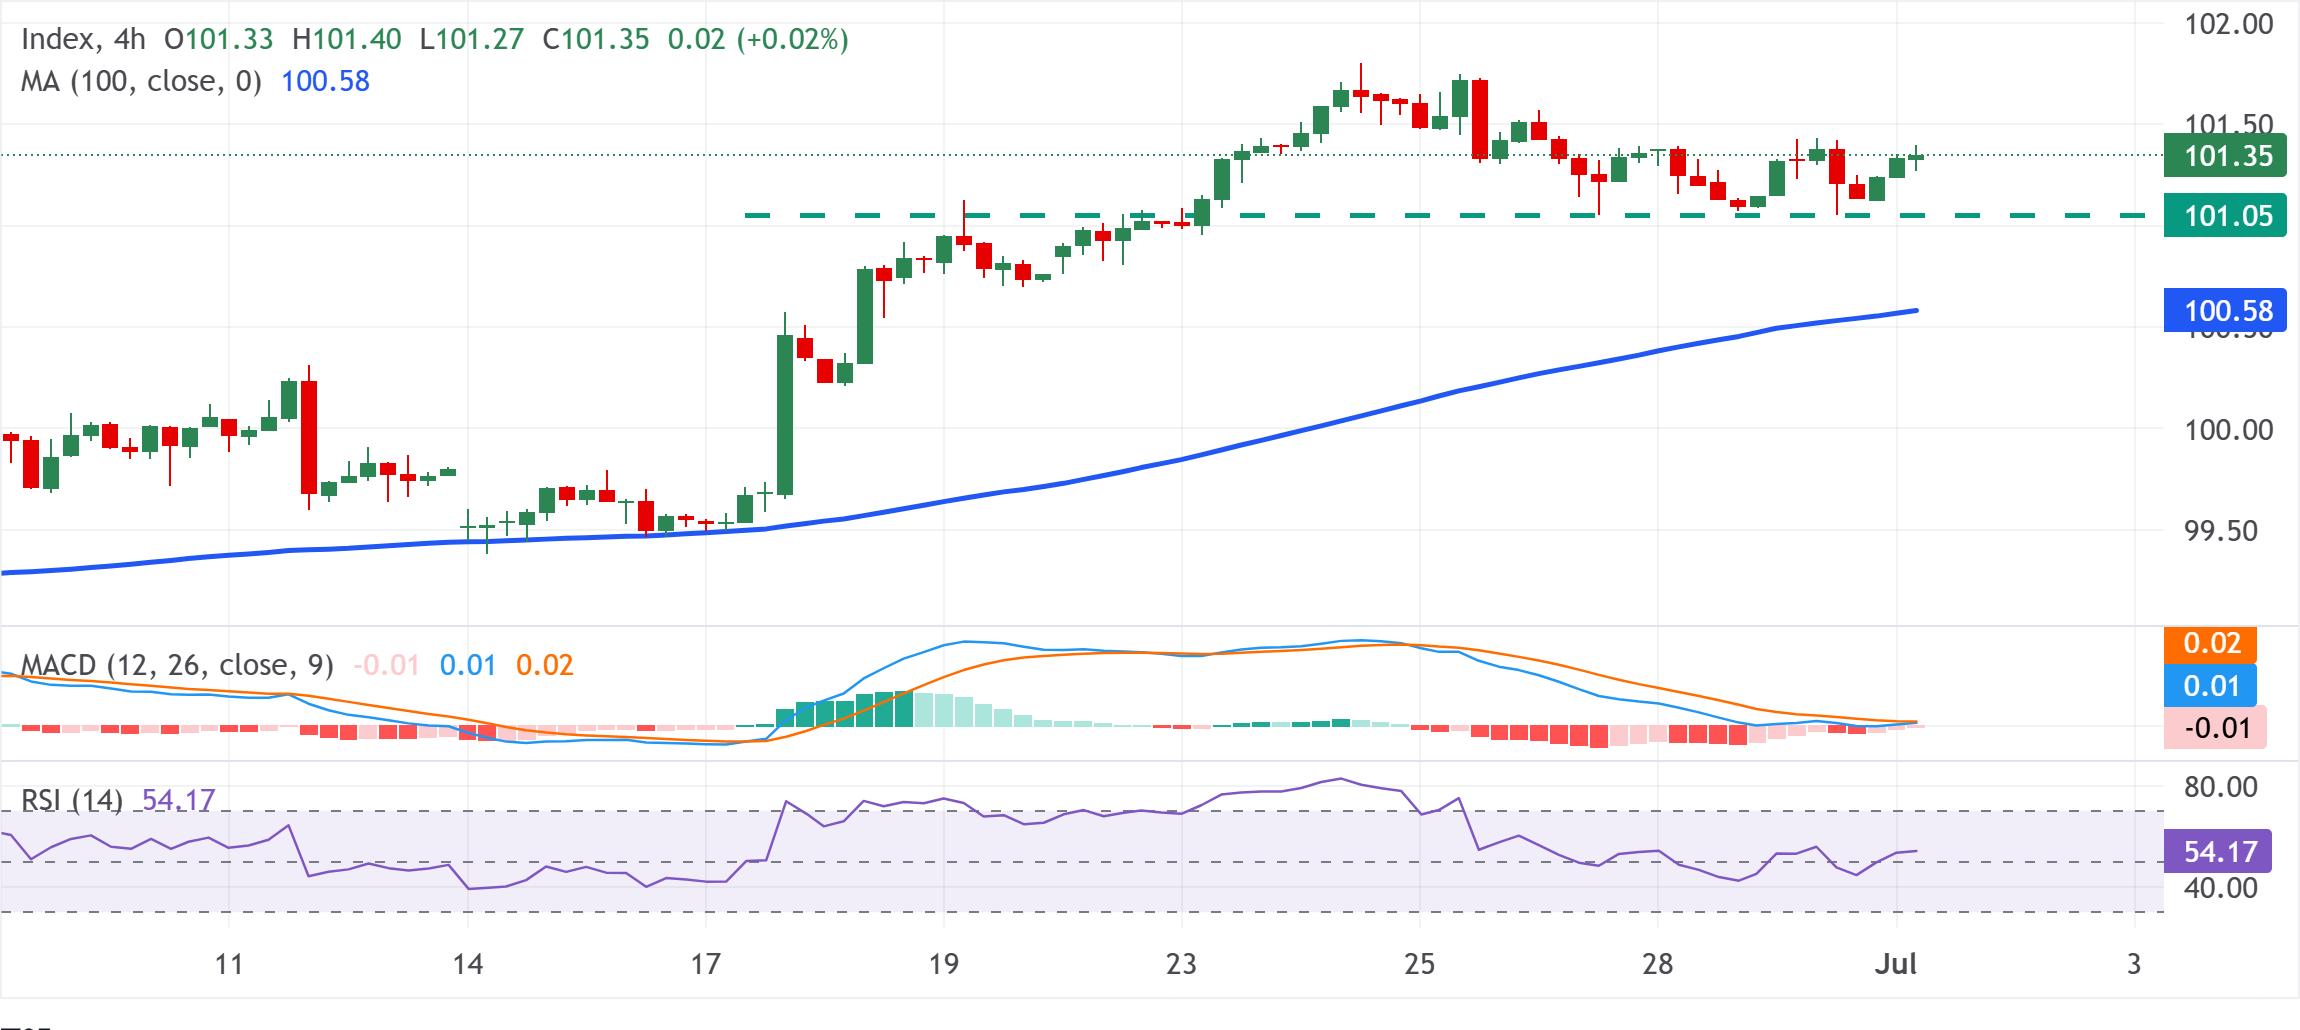
A sustained break back below the pivot, however, would hint at the onset of a corrective pullback within the broader constructive setup as depicted by still-supportive momentum indicators. On the upside, immediate resistance is pegged around the 101.80 zone or the highest since May 2025, touched last week, ahead of the 102.00 mark. Some follow-through buying will reaffirm the bullish outlook and pave the way for an extension of the uptrend from the May swing low, near the 97.62 area.
(The technical analysis of this story was written with the help of an AI tool.)
Economic Indicator
Fed's Chair Warsh speech
Kevin Warsh took office as chairman of the Board of Governors of the Federal Reserve in May 2026, for a four-year term ending in 2030. His term as a member of the Board of Governors will expire in May 2040. Warsh, born in Albany (New York) on April 13, 1970, is an American financier and attorney who already served as a member of the Fed Board of Governors from 2006 to 2011 and was significantly involved in the central bank's response to the financial crisis.
Read more.Next release: Wed Jul 01, 2026 13:00
Frequency: Irregular
Consensus: -
Previous: -
Source: Federal Reserve
Author

Haresh Menghani
FXStreet
Haresh Menghani is a detail-oriented professional with 10+ years of extensive experience in analysing the global financial markets.