US Dollar Index Price Forecast: Bearish bias remains unchanged near 98.00
- The US Dollar Index edges lower to around 97.90 in Wednesday’s early European session.
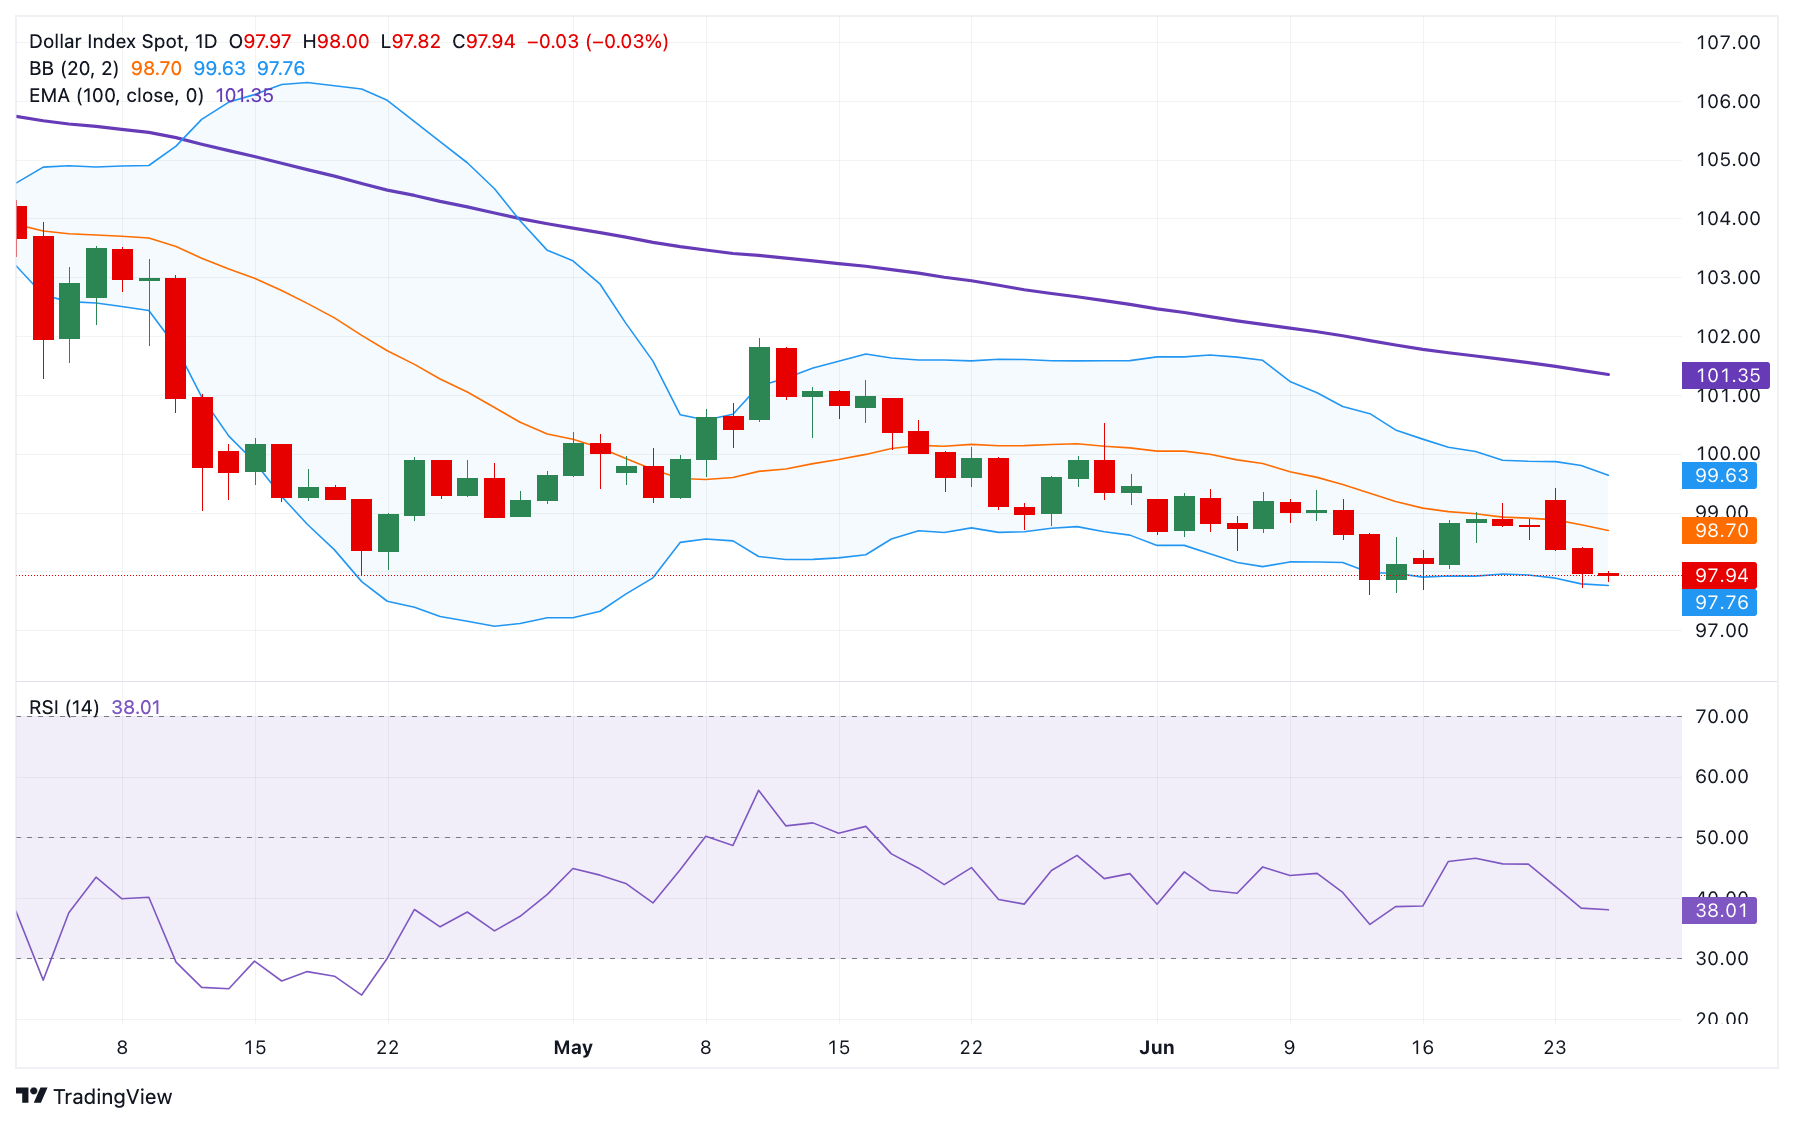
- The negative outlook of the index remains in play below the 100-day EMA with a bearish RSI indicator.
- The first support level to watch is 97.75; the immediate resistance level is seen at 99.16.

The US Dollar Index (DXY), an index of the value of the US Dollar (USD) measured against a basket of six world currencies, extends the decline to near 97.90 during the early European session on Wednesday. Growing optimism that a ceasefire between Israel and Iran will hold after it was touted by US President Donald Trump weighs on the safe-haven currency like the Greenback.
According to the daily chart, the bearish sentiment of DXY prevails as the index is below the key 100-day Exponential Moving Average (EMA). Furthermore, the downward momentum is supported by the 14-day Relative Strength Index (RSI), which stands below the midline near 37.95, supporting the sellers in the near term.
The initial support level for the US Dollar Index emerges at 97.75, the lower limit of the Bollinger Band. Further south, the additional downside filter to watch is 97.61, the low of June 12. The next contention level is seen at 96.55, the low of February 25, 2022.
On the bright side, the first upside barrier for the DXY is located at 99.16, the high of June 19. Any follow-through buying above this level could pave the way to 99.65, the upper boundary of the Bollinger Band. A decisive break above the mentioned level could see a rally to the 100.00 psychological level, en route to 101.35, the 100-day EMA.
US Dollar Index (DXY) daily chart
US Dollar FAQs
The US Dollar (USD) is the official currency of the United States of America, and the ‘de facto’ currency of a significant number of other countries where it is found in circulation alongside local notes. It is the most heavily traded currency in the world, accounting for over 88% of all global foreign exchange turnover, or an average of $6.6 trillion in transactions per day, according to data from 2022. Following the second world war, the USD took over from the British Pound as the world’s reserve currency. For most of its history, the US Dollar was backed by Gold, until the Bretton Woods Agreement in 1971 when the Gold Standard went away.
The most important single factor impacting on the value of the US Dollar is monetary policy, which is shaped by the Federal Reserve (Fed). The Fed has two mandates: to achieve price stability (control inflation) and foster full employment. Its primary tool to achieve these two goals is by adjusting interest rates. When prices are rising too quickly and inflation is above the Fed’s 2% target, the Fed will raise rates, which helps the USD value. When inflation falls below 2% or the Unemployment Rate is too high, the Fed may lower interest rates, which weighs on the Greenback.
In extreme situations, the Federal Reserve can also print more Dollars and enact quantitative easing (QE). QE is the process by which the Fed substantially increases the flow of credit in a stuck financial system. It is a non-standard policy measure used when credit has dried up because banks will not lend to each other (out of the fear of counterparty default). It is a last resort when simply lowering interest rates is unlikely to achieve the necessary result. It was the Fed’s weapon of choice to combat the credit crunch that occurred during the Great Financial Crisis in 2008. It involves the Fed printing more Dollars and using them to buy US government bonds predominantly from financial institutions. QE usually leads to a weaker US Dollar.
Quantitative tightening (QT) is the reverse process whereby the Federal Reserve stops buying bonds from financial institutions and does not reinvest the principal from the bonds it holds maturing in new purchases. It is usually positive for the US Dollar.
Author

Lallalit Srijandorn
FXStreet
Lallalit Srijandorn is a Parisian at heart. She has lived in France since 2019 and now becomes a digital entrepreneur based in Paris and Bangkok.


