Breaking: UoM Consumer Sentiment Index is seen improving to 54.4 in July

American consumer confidence regained momentum in early July, as households grew more optimistic about current conditions and the broader economic outlook, according to preliminary data from the University of Michigan.
The closely watched Consumer Sentiment Index is expected to improve to 54.4 from 49.5 in the previous month, surpassing economists’ expectations and signalling a better backdrop for public confidence.
Furthermore, the Current Conditions index climbed to 54.9 from 47.7, while the Expectations gauge rose to 54.0 from 50.7, highlighting some change of view regarding the months ahead.
Inflation expectations, meanwhile, came in mixed. The one-year outlook eased to 4.2% from 4.6%, and the five-year forecast held steady at 3.3%, suggesting that consumers are seeing some loss of momentum in price pressures, in line with recent inflation data.
Market reaction
The dollar remains slightly bid amid the broader choppiness seen throughout the week. That said, the US Dollar Index (DXY) navigates the 100.80 region in the wake of the data release, adding to Thursday’s rebound.
US Dollar Price Today
The table below shows the percentage change of US Dollar (USD) against listed major currencies today. US Dollar was the strongest against the Australian Dollar.
| USD | EUR | GBP | JPY | CAD | AUD | NZD | CHF | |
|---|---|---|---|---|---|---|---|---|
| USD | 0.05% | 0.19% | -0.02% | -0.22% | 0.24% | 0.11% | -0.14% | |
| EUR | -0.05% | 0.14% | -0.07% | -0.31% | 0.19% | 0.06% | -0.20% | |
| GBP | -0.19% | -0.14% | -0.24% | -0.45% | 0.04% | -0.07% | -0.35% | |
| JPY | 0.02% | 0.07% | 0.24% | -0.21% | 0.26% | 0.12% | -0.12% | |
| CAD | 0.22% | 0.31% | 0.45% | 0.21% | 0.48% | 0.35% | 0.09% | |
| AUD | -0.24% | -0.19% | -0.04% | -0.26% | -0.48% | -0.15% | -0.40% | |
| NZD | -0.11% | -0.06% | 0.07% | -0.12% | -0.35% | 0.15% | -0.26% | |
| CHF | 0.14% | 0.20% | 0.35% | 0.12% | -0.09% | 0.40% | 0.26% |
The heat map shows percentage changes of major currencies against each other. The base currency is picked from the left column, while the quote currency is picked from the top row. For example, if you pick the US Dollar from the left column and move along the horizontal line to the Japanese Yen, the percentage change displayed in the box will represent USD (base)/JPY (quote).
This section below was published as a preview of the preliminary print of the University of Michigan Consumer Sentiment for July at 12:30 GMT.
- The Preliminary Michigan Consumer Sentiment Index is expected to rise to 51 in July from 49.5 in June.
- The decline in consumer prices seen earlier this week is likely to have contributed to lifting sentiment.
- A positive surprise on UoM Consumer Sentiment might provide some support to a weak US Dollar.
The University of Michigan (UoM) will release the preliminary estimate of July’s Consumer Sentiment Index on Friday. The UoM report, measuring consumers’ feelings about personal finances, business conditions, and purchasing plans, is expected to show that consumers’ confidence improved for the second consecutive month in July, although remaining at levels well below those before the start of the US-Iran war.
US consumers’ confidence is seen improving to 51 in July, from June’s 49.5 reading, as measured by the UoM Consumer Sentiment Index. These numbers would show some progress from May’s record low of 44.8, but also a considerable deterioration from the 56.6 level seen in February, just before the US and Israel attacked Iran for the first time.
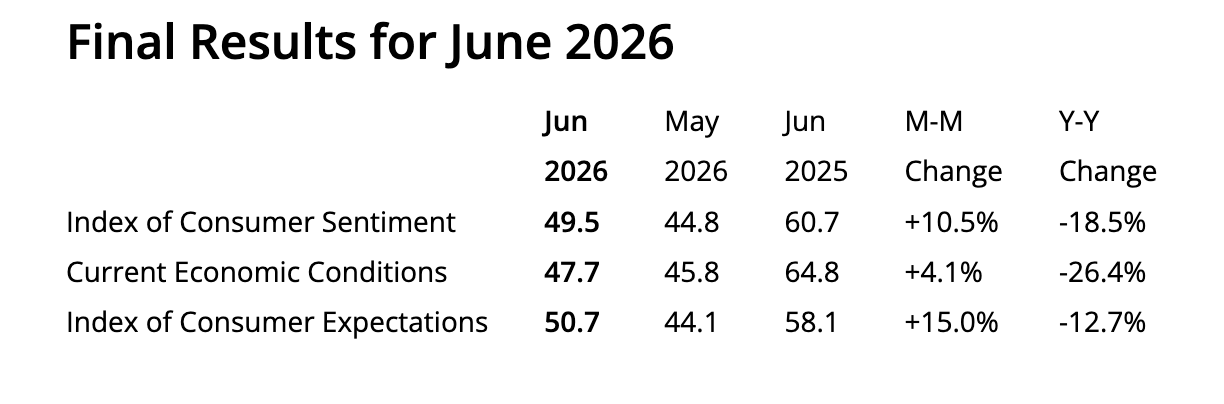
Consumer spending is a key contributor to US economic activity, accounting for about 70% of the country’s Gross Domestic Product (GDP), and the Michigan Consumer Sentiment Index is considered a reliable forward-looking indicator of US economic trends. In that sense, any deviation from the market consensus tends to have a significant impact on US Dollar (USD) crosses.
What to expect from June’s UoM Consumer Sentiment Index report?
Markets will be attentive to July’s consumer sentiment data to assess the extent to which the ebbing inflationary pressures have brightened US consumers’ mood. Oil prices have retreated from the highs seen at the height of the war in the Middle East, and recent numbers revealed that consumer and producer inflation fell beyond expectations in June. It remains to be seen, however, if the macroeconomic trend has reached Main Street.
June's University of Michigan report highlighted the moderation in gas prices as a key factor in explaining the improvement in consumer sentiment, with business conditions brightening as concerns about the economic consequences of Iran’s conflict apparently start to abate.
Inflation has receded further in the meantime. Crude prices are nearly 30% below the levels seen in April and May, helping ease price pressures.
Recent data from the US Bureau of Labor Statistics revealed that the US Consumer Price Index (CPI) contracted 0.4% MoM in June, its sharpest monthly fall in nearly six years, and that yearly inflation slowed down to 3.5%, the lowest growth rate since March.
US Producer Price Index (PPI) figures, released on Wednesday, confirmed the easing price pressures. Inflation at factory gates contracted against expectations in June, and the yearly PPI eased to 5.5% from a revised 6% in May, when the market was hoping for further acceleration to 6.2%.
On Thursday, US Retail Sales data showed a mild increase, while US Jobless Claims added to evidence that the labour market has stabilized. Putting it all together, the picture shows an improving scenario that might lead to a positive surprise on the UoM Consumer Sentiment data due later in the day.
When will the UoM Consumer Sentiment Index be released, and how could it affect the US Dollar?
The University of Michigan will release its Consumer Sentiment Index, together with the Consumer Inflation Expectations survey, on Friday at 14:00 GMT. The market consensus hints at a moderate improvement from May’s reading, yet at levels significantly below pre-war ones, and nearly 20% below the July 2025 reading.
The US Dollar has been trading lower this week, as investors pared back bets of immediate Federal Reserve interest rate hikes, although the escalation of hostilities in the Middle East is keeping the Greenback supported.
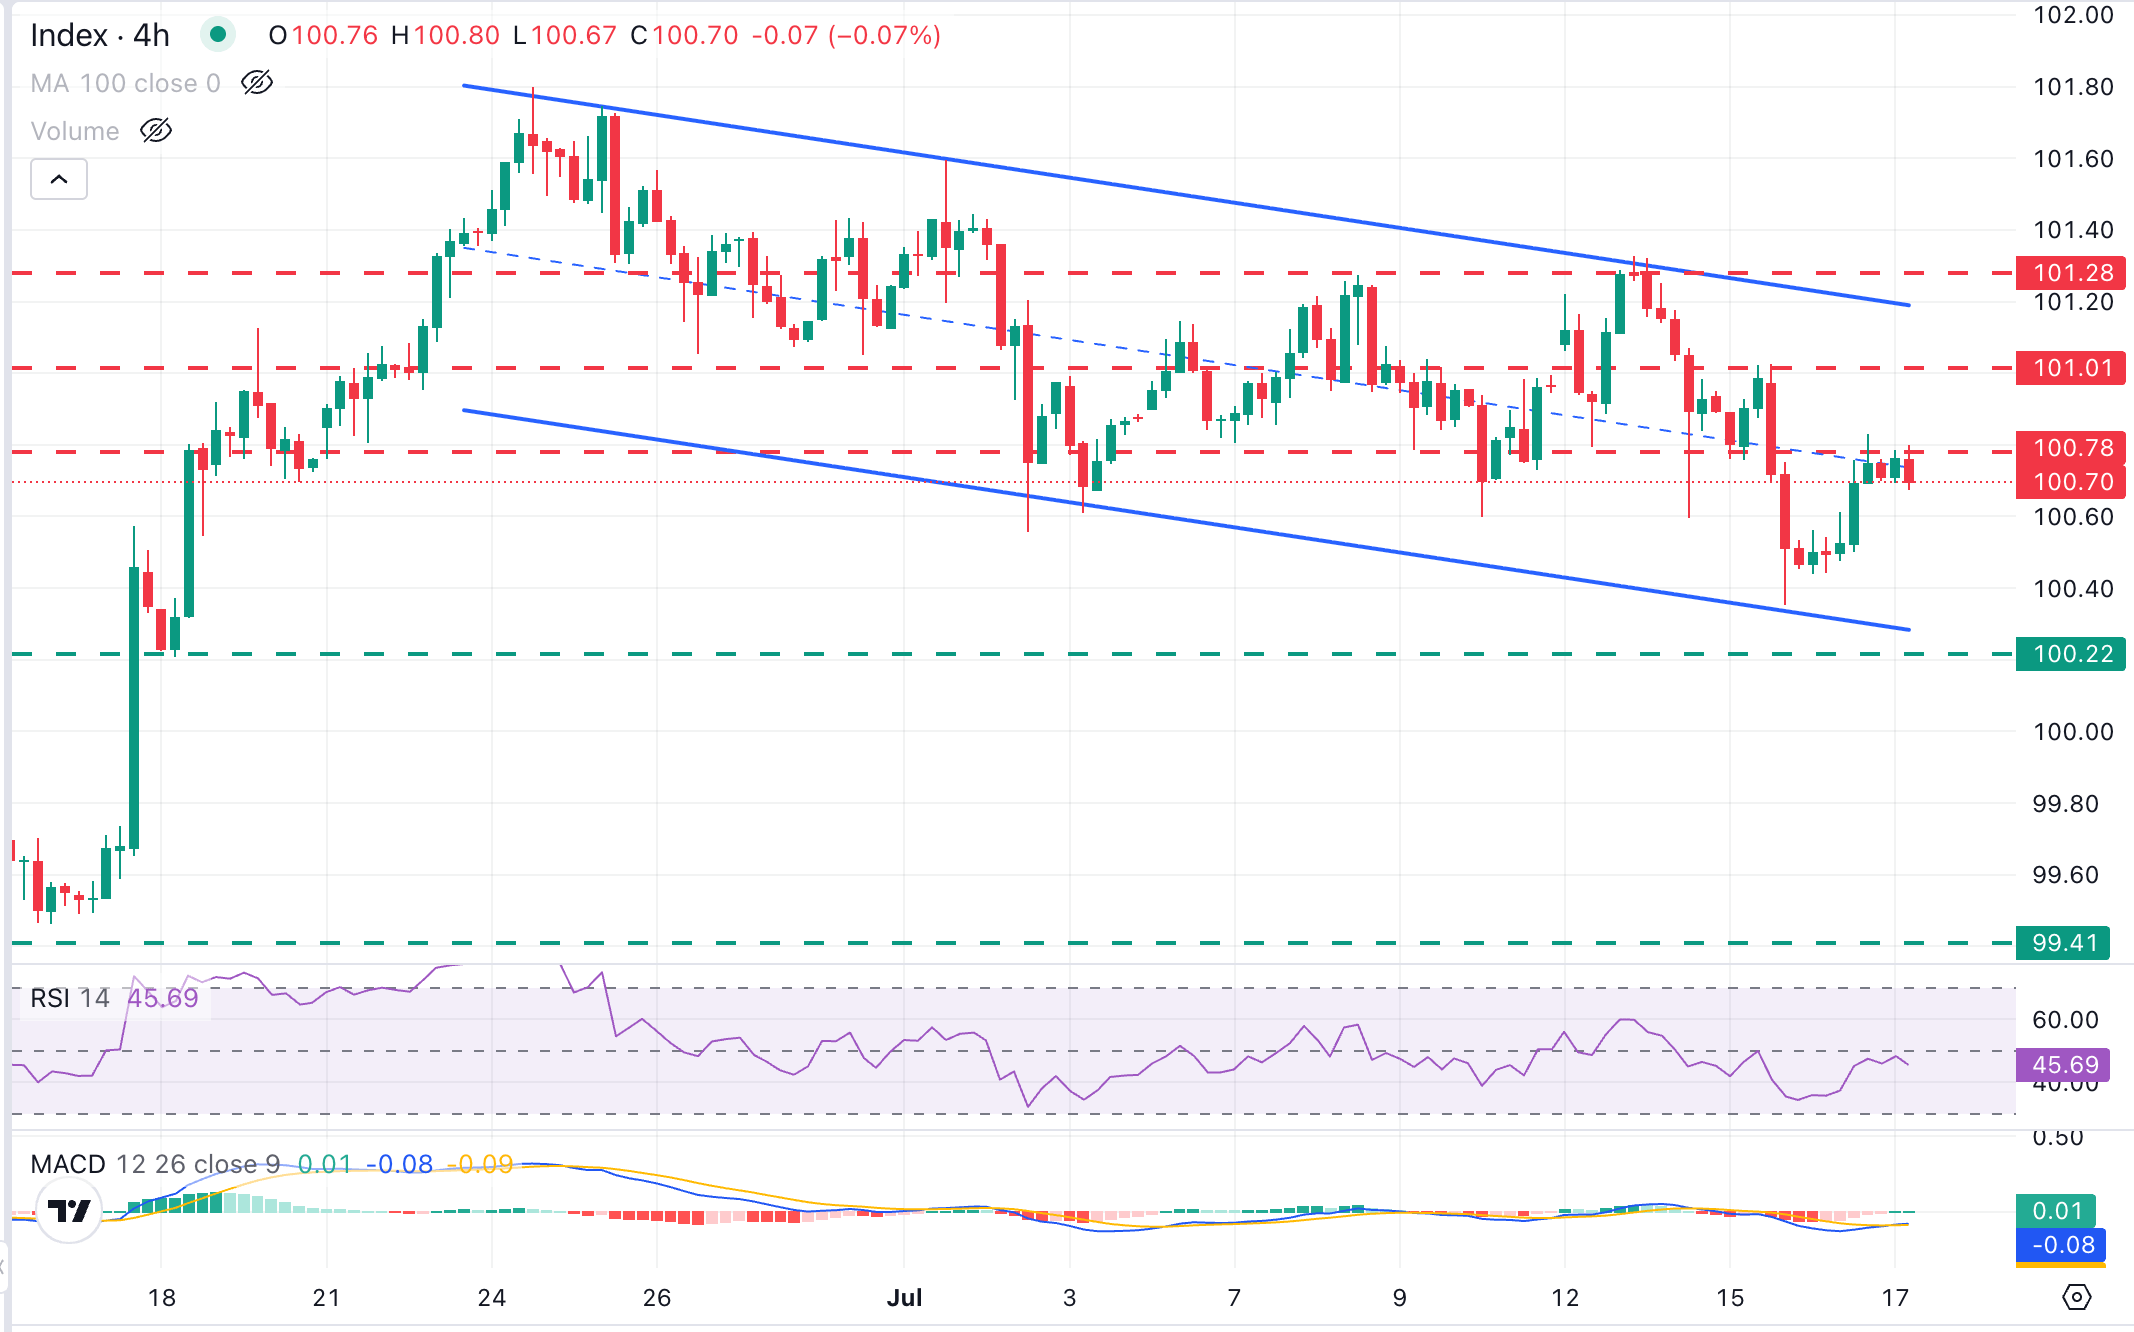
The US Dollar Index Spot (DXY) trades just above the 100.00 level at the time of writing, with momentum indicators on the 4-hour chart highlighting a neutral-to-bearish stance, and the bigger picture showing price action contained within a descending channel, in an extended correction of the May-June rally.
The DXY found support at the base of the channel this week and looks stalled below the 100.80 area, although the key resistance area lies between 101.00 and 101.30, where the July 15 high at 101.03, the channel top, now around 101.20, and the July 13 high at 101.33 are likely to challenge bulls. A confirmation above that area would negate the bearish trend and expose the year-to-date high at 101.80.
On the downside, the confluence of trendline support with the June 18 low, in the 100.20 area, is likely to provide significant support. If that level gives way, bears might gain confidence to test mid-June lows in the 99.50 area.
(The technical analysis of this story was written with the help of an AI tool. Know more.)
Economic Indicator
Michigan Consumer Sentiment Index
The Michigan Consumer Sentiment Index, released on a monthly basis by the University of Michigan, is a survey gauging sentiment among consumers in the United States. The questions cover three broad areas: personal finances, business conditions and buying conditions. The data shows a picture of whether or not consumers are willing to spend money, a key factor as consumer spending is a major driver of the US economy. The University of Michigan survey has proven to be an accurate indicator of the future course of the US economy. The survey publishes a preliminary, mid-month reading and a final print at the end of the month. Generally, a high reading is bullish for the US Dollar (USD), while a low reading is bearish.
Read more.Next release: Fri Jul 17, 2026 14:00 (Prel)
Frequency: Monthly
Consensus: 51
Previous: 49.5
Source: University of Michigan
Consumer exuberance can translate into greater spending and faster economic growth, implying a stronger labor market and a potential pick-up in inflation, helping turn the Fed hawkish. This survey’s popularity among analysts (mentioned more frequently than CB Consumer Confidence) is justified because the data here includes interviews conducted up to a day or two before the official release, making it a timely measure of consumer mood, but foremost because it gauges consumer attitudes on financial and income situations. Actual figures beating consensus tend to be USD bullish.
Inflation FAQs
Inflation measures the rise in the price of a representative basket of goods and services. Headline inflation is usually expressed as a percentage change on a month-on-month (MoM) and year-on-year (YoY) basis. Core inflation excludes more volatile elements such as food and fuel which can fluctuate because of geopolitical and seasonal factors. Core inflation is the figure economists focus on and is the level targeted by central banks, which are mandated to keep inflation at a manageable level, usually around 2%.
The Consumer Price Index (CPI) measures the change in prices of a basket of goods and services over a period of time. It is usually expressed as a percentage change on a month-on-month (MoM) and year-on-year (YoY) basis. Core CPI is the figure targeted by central banks as it excludes volatile food and fuel inputs. When Core CPI rises above 2% it usually results in higher interest rates and vice versa when it falls below 2%. Since higher interest rates are positive for a currency, higher inflation usually results in a stronger currency. The opposite is true when inflation falls.
Although it may seem counter-intuitive, high inflation in a country pushes up the value of its currency and vice versa for lower inflation. This is because the central bank will normally raise interest rates to combat the higher inflation, which attract more global capital inflows from investors looking for a lucrative place to park their money.
Formerly, Gold was the asset investors turned to in times of high inflation because it preserved its value, and whilst investors will often still buy Gold for its safe-haven properties in times of extreme market turmoil, this is not the case most of the time. This is because when inflation is high, central banks will put up interest rates to combat it. Higher interest rates are negative for Gold because they increase the opportunity-cost of holding Gold vis-a-vis an interest-bearing asset or placing the money in a cash deposit account. On the flipside, lower inflation tends to be positive for Gold as it brings interest rates down, making the bright metal a more viable investment alternative.
Author

FXStreet Team
FXStreet
Composed of a group of economic journalists and FX experts, the FXStreet content team produces and oversees all content published on FXStreet. It provides a purely journalistic approach to the Forex market.

















