United States Treasury yields read Iran strikes as inflation
- US10Y trades near 4.79%, its highest level since January 2025.
- The two-year is moving faster than the 10-year, up nearly five basis points.
- No cut priced at any meeting through the end of 2027.

The 10-year Treasury yield trades near 4.79%, roughly four basis points higher and at its highest level since January 2025, in a fifth consecutive session of selling. The two-year moved further still, adding closer to five basis points to trade near 4.39%, and it did so as American forces began striking Islamic Revolutionary Guard Corps (IRGC) targets inside Iran. An announced military escalation would ordinarily buy duration a bid, and this one produced the opposite.
The front end is doing the work
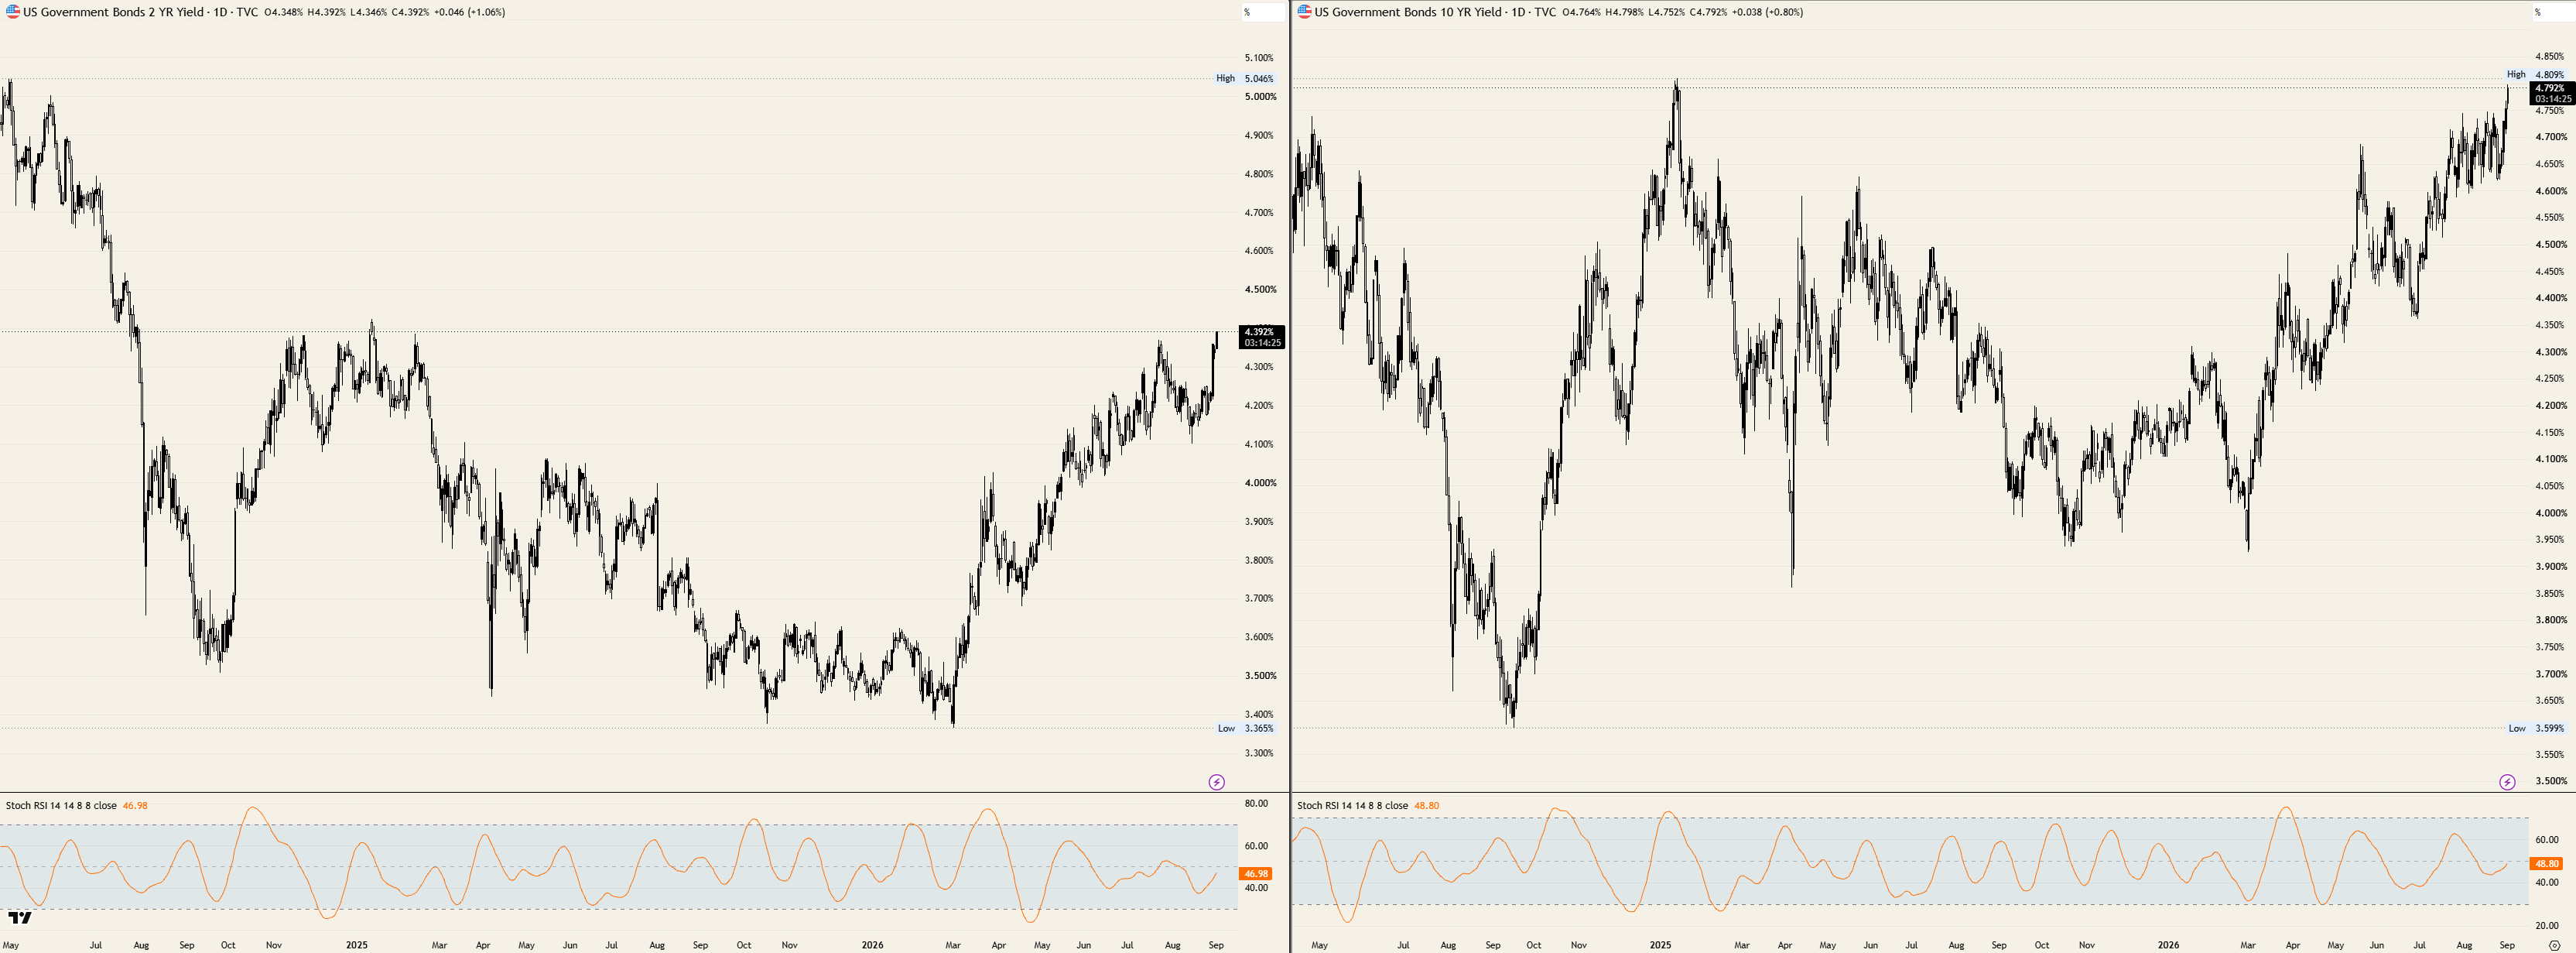
The shape of Tuesday's move matters more than its size. The two-year yield is up about 1.06% against 0.80% at the benchmark, and it has been the faster mover through the entire repricing, climbing from near 3.35% at the March low to within a few basis points of 4.40%. Front-end leadership is not what a geopolitical risk premium looks like.
A market genuinely buying war risk bids duration and steepens the curve on term premium. This one sold the two-year hardest, which is a statement about the September 16 meeting rather than about the Strait of Hormuz. The strait still matters, but it reaches the curve through the price of a barrel and therefore through the committee's inflation problem, not through any flight to safety.
The buyback has round-tripped
The 30-year sits back near 5.28%, roughly where it was before the Treasury Department doubled the size of its long-dated buyback operation in August, lifting the maximum from $2 billion to at least $4 billion for a programme running through November. That announcement initially pulled the yield down to 5.19%. All of it has been given back inside a fortnight.
Federal debt passed $40 trillion two weeks ago and the long end is being asked to absorb what that implies for issuance. A buyback is a liquidity instrument, and the round trip is the market's verdict on whether liquidity was ever the constraint. The problem is global rather than American: Japan's 10-year touched 3% for the first time since 1996 on Tuesday, and French and German long ends extended to multi-year highs alongside it.
A front end pricing a floor, not a cycle
Futures put a hike at the September 16 meeting near 68%, up from roughly 35% before the Jackson Hole keynote, and give the October 28 meeting a 95% probability of a target range at 3.75% to 4.00% or higher. December splits close to evenly on a second move, and the higher range is 81% priced by the January 27 meeting.
What the strip does beyond that is the part the two-year is actually trading. From December onward the current 3.50% to 3.75% range carries no probability at all, and every 2027 meeting on the board prices a floor of 4.00% to 4.25% or above. This is not a curve discounting a short defensive cycle with an exit. It is discounting a level.
The commentary is pulling the same way. A voting Federal Reserve governor said Tuesday morning that the committee should act decisively to raise rates if inflation does not appear to be moderating sufficiently, and pointed at the September 15-16 meeting. The Institute for Supply Management (ISM) manufacturing survey released the same morning made his case for him, with the headline missing at 54.6 against a 55.2 consensus while the prices paid index printed 71.1 for a second month.
The numbers that carry the week
Private payrolls land Wednesday at 12:15 GMT with 48K forecast against 44K, followed by the Beige Book at 18:00 GMT. The ISM services Purchasing Managers Index (PMI) arrives Thursday at 14:00 GMT with a 54.3 forecast against 54.1, and its own prices paid line was last at 70.3.
Friday's August employment report is forecast at 58K after a 23K contraction, with the unemployment rate held at 4.1% and average hourly earnings accelerating to 0.3% MoM from 0.1% against 3% YoY from 3.2%. Two more inflation readings, the Consumer Price Index (CPI) and the Producer Price Index (PPI), land the following week ahead of the vote. For a front end priced at 68%, the services price line and those two prints carry more weight than the payroll number.
Levels to watch
Resistance: The session high just short of 4.80% is the immediate line on the 10-year, with the January 2025 peak near 4.81% directly above it and nothing structural between there and 5.00%. The two-year faces 4.40% and then the 4.50% area.
Support: The 10-year holds above the session low near 4.75%, with 4.70% beneath it and the August range floor near 4.60% the level that would end the sequence. The two-year has 4.35% and then 4.25% under it.
Bias: Higher. The 10-year takes out the January 2025 peak and the two-year clears 4.50% while the September vote stays live, with a daily close back beneath 4.70% on the benchmark the only thing that argues otherwise. Both daily Stochastic Relative Strength Index (Stoch RSI) readings sit mid-range, near 47 on the two-year and 49 on the benchmark, so nothing here is stretched.
US Treasury yields, 2-year and 10-year
Author

Joshua Gibson
FXStreet
Joshua joins the FXStreet team as an Economics and Finance double major from Vancouver Island University with twelve years' experience as an independent trader focusing on technical analysis.

















