United States Dollar weakens on US-Iran peace deal but remains supported by hawkish Fed outlook
- The US Dollar trades under pressure on Monday as easing geopolitical tensions weigh on safe-haven demand.
- A hawkish Fed outlook and resilient US economy continue to underpin the Greenback.
- Technically, the DXY remains above key moving averages, although momentum indicators suggest bullish momentum is easing.

The US Dollar (USD) trades on the back foot against its major peers on Monday as traders trim safe-haven positions amid improving market sentiment after the United States and Iran agreed on a framework peace deal that would reopen the Strait of Hormuz.
The US Dollar Index (DXY), which tracks the Greenback's value against a basket of six major currencies, trades around 99.57 at the time of writing after slipping to a one-week low near 99.38 earlier in the day.
The downside in the Greenback appears limited in the near term as traders remain reluctant to place aggressive bearish bets before the final agreement is formally signed on Friday.
Meanwhile, markets are also awaiting the Federal Reserve's (Fed) monetary policy announcement on Wednesday, where policymakers are widely expected to keep interest rates unchanged.
What's next for the US Dollar?
Even as geopolitical tensions ease and Oil prices move lower, the US Dollar is likely to remain supported by a hawkish Fed outlook.
Before the war, markets were expecting at least two Fed rate cuts this year. However, that outlook has shifted as the inflationary impact of higher energy prices pushed inflation sharply higher in recent months, prompting traders to price in the possibility of a rate hike by year-end.
While a further decline in Oil prices could lead markets to scale back those rate-hike expectations, the Fed is unlikely to resume rate cuts until inflation shows clearer signs of moving back toward the central bank's 2% target. Meanwhile, a stabilizing labor market and resilient economic activity give policymakers room to keep interest rates unchanged for an extended period.
On the other hand, any setback in the peace process or renewed tensions in the Middle East could revive safe-haven demand for the US Dollar.
Technical analysis:
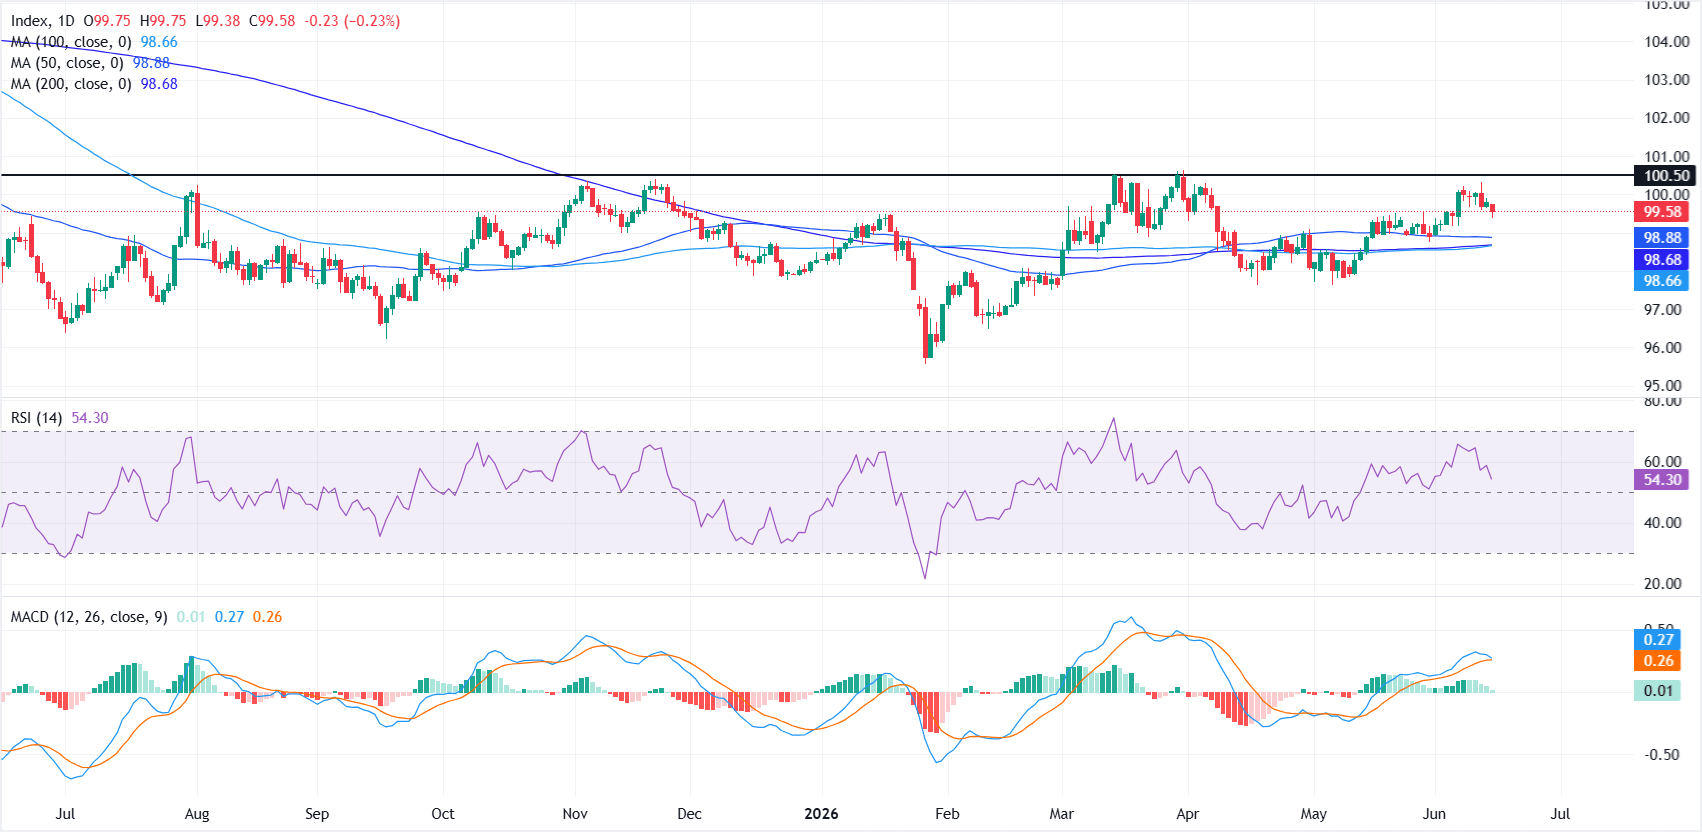
The near-term bias is constructive as the DXY holds clearly above the 50-, 100- and 200-day Simple Moving Averages (SMAs), suggesting a supportive underlying trend.
The Relative Strength Index (RSI) has eased back toward the mid-50s, hinting at a consolidative pause rather than outright exhaustion, while the Moving Average Convergence Divergence (MACD) drifts toward the signal line with a fading positive profile, indicating moderating bullish momentum rather than a clear reversal.
On the downside, immediate support is now reinforced by the recent price pivot at 99.50, with the 50-day SMA at 98.88 offering the next cushion and the 200-day and 100-day SMAs around 98.70 forming a broader demand zone should a deeper pullback unfold.
On the topside, initial resistance is seen at the recent horizontal cap near 100.50, where a break would open the way for further gains.
(The technical analysis of this story was written with the help of an AI tool.)
US Dollar Price Today
The table below shows the percentage change of US Dollar (USD) against listed major currencies today. US Dollar was the strongest against the New Zealand Dollar.
| USD | EUR | GBP | JPY | CAD | AUD | NZD | CHF | |
|---|---|---|---|---|---|---|---|---|
| USD | -0.28% | -0.15% | 0.03% | -0.06% | -0.42% | 0.07% | -0.40% | |
| EUR | 0.28% | 0.13% | 0.33% | 0.25% | -0.15% | 0.36% | -0.13% | |
| GBP | 0.15% | -0.13% | 0.19% | 0.12% | -0.29% | 0.25% | -0.27% | |
| JPY | -0.03% | -0.33% | -0.19% | -0.07% | -0.46% | 0.00% | -0.46% | |
| CAD | 0.06% | -0.25% | -0.12% | 0.07% | -0.37% | 0.10% | -0.37% | |
| AUD | 0.42% | 0.15% | 0.29% | 0.46% | 0.37% | 0.52% | 0.05% | |
| NZD | -0.07% | -0.36% | -0.25% | -0.01% | -0.10% | -0.52% | -0.50% | |
| CHF | 0.40% | 0.13% | 0.27% | 0.46% | 0.37% | -0.05% | 0.50% |
The heat map shows percentage changes of major currencies against each other. The base currency is picked from the left column, while the quote currency is picked from the top row. For example, if you pick the US Dollar from the left column and move along the horizontal line to the Japanese Yen, the percentage change displayed in the box will represent USD (base)/JPY (quote).
Author

Vishal Chaturvedi
FXStreet
I am a macro-focused research analyst with over four years of experience covering forex and commodities market. I enjoy breaking down complex economic trends and turning them into clear, actionable insights that help traders stay ahead of the curve.