|

The S&P500 continues to follow mid-term election year seasonality

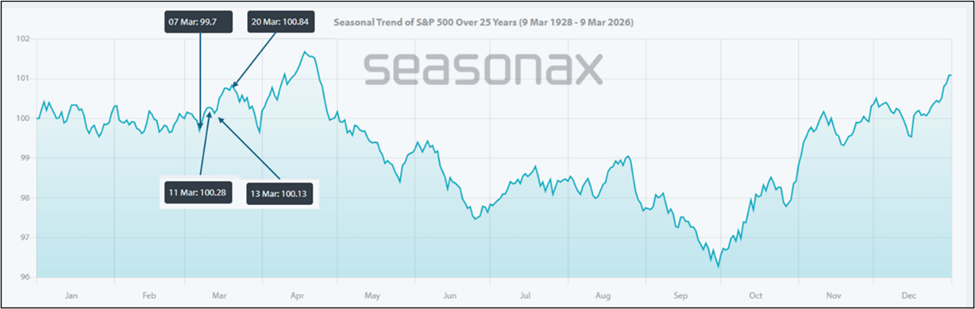
In our update from December 19 last year, we introduced mid-term election-year seasonality, showing an important peak would be due around April 18. See Figure 1 below. A seasonality chart is based on closing prices and portrays relative price movement. E.g., a new high in the seasonality chart can be a secondary high in the markets. Besides, it continues to align well with the current market. Or is it the other way around?

Namely, a low was due around March 7, a high around March 11, another low around March 13, and a larger peak around March 20. We used “around” because these dates are approximately +/- 5 trading days. So far, the index bottomed on a closing basis on March 6, peaked on March 9, and is now declining today, March 13. An up day today or early next week would confirm the trend change.

Figure 1. Average seasonal pattern during mid-term election years for the SPX since 1928
So far, so good, but how has the track record been year-to-date? We’ve tabulated the most important highs and lows for seasonality and compared them with this year's. See Table 1 below.

Table 1: YTD comparison between seasonality and actual market highs and lows
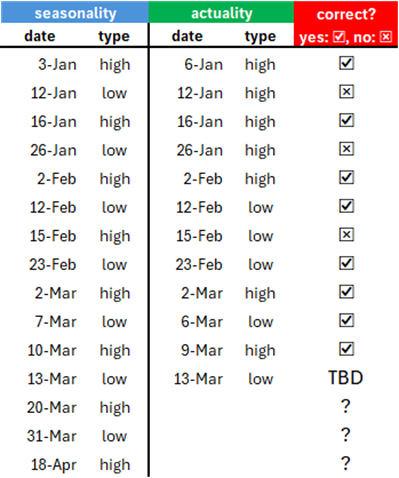
It follows that out of the eleven most important highs and lows during mid-term election years, the current market peaked and bottomed out eight times at almost the exact same date. Three times it missed the mark. Thus far, the index has followed mid-term election-year seasonality well (73% of the time).

Although, of course, past performance is no guarantee for future results, it does suggest that we should continue to expect the market to follow this path going forward: a bottom around today, a rally to approximately March 20, then two weeks of decline, followed by a final rally into the April 18 high. As illustrated using our Elliott Wave count in Figure 2 below.

Figure 2. Short-term Elliott wave count for the SPX since October 2025
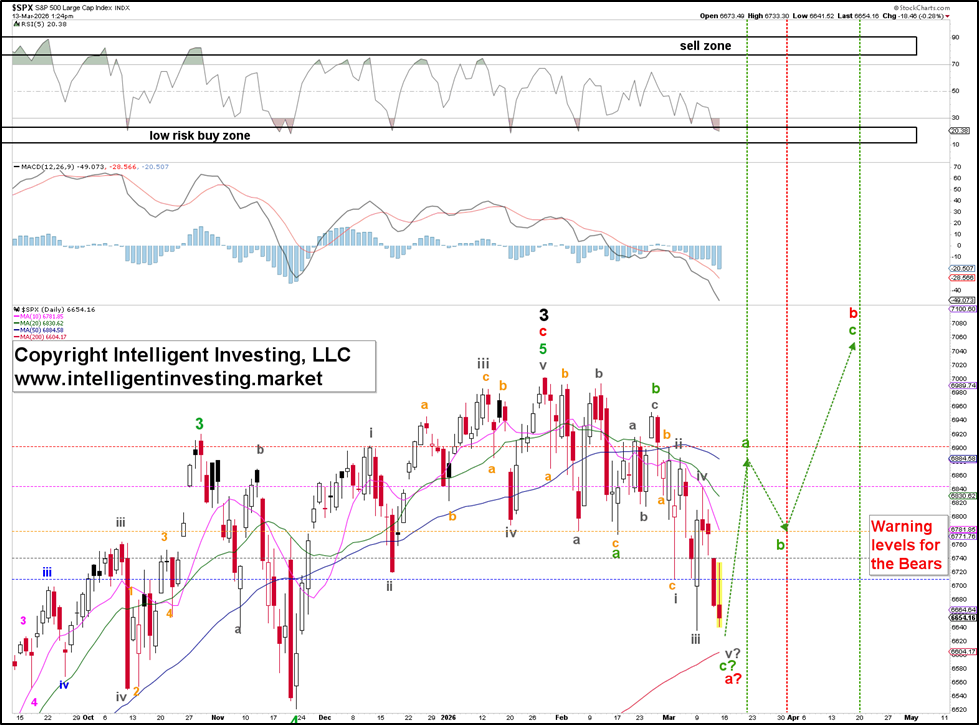
Since December, when we introduced this seasonality, the market has responded quite well. Therefore, moving forward, we must assume it will continue. However, we stay vigilant and will—as always—monitor the price action to identify any deviations: anticipate, observe, and adjust if needed.

Author

Dr. Arnout Ter Schure

Dr. Arnout Ter Schure

Intelligent Investing, LLC

After having worked for over ten years within the field of energy and the environment, Dr.

More from Dr. Arnout Ter Schure
Share:

Editor's Picks

AUD/USD bulls regain control above 0.6950 amid USD retreat

AUD/USD regains traction and extends the previous day's bounce from the weekly low, aiming for 0.7000 in Asia on Friday. The overnight pullback in US bond yields keeps the US Dollar below an 18-month high, which in turn offers some support to the pair. Meanwhile, hawkish RBA expectations also keep the major underpinned.

USD/JPY holds gains near 158.00 after Japan's weak Household Spending data

USD/JPY clings to gains around 158.00 after data showed on Friday that Japan's Household Spending fell for the ninth straight month, undermining the Japanese Yen. Meanwhile, the US Dollar remains depressed as the overnight fall in US bond yields counters a hawkish Fed and geopolitical uncertainties, could cap any downside in the pair.

Gold remains range-bound below $4,200

Gold has given up some ground after an initial bullish attempt to reach weekly highs, returning to below the $4,200 mark per troy ounce on Friday. The US Dollar’s strong upside momentum, combined with rising US Treasury yields across the curve, seems to keep further gains in the yellow metal under scrutiny.

Has Bitcoin really escaped the macro forces it was built to fight?
Over 17 years ago, Satoshi Nakamoto designed Bitcoin (BTC) on the back of a global financial crisis as an alternative to the global monetary system outside the control of central banks, governments and traditional intermediaries. This raises a key question: has Bitcoin really become independent of the macroeconomic forces it was built to challenge?
The Euro is not the sick man of Europe. France's bond market is
EUR/USD remains under pressure, near the 17-month low of 1.1161 reached on Monday. The pair has lost more than 7% since its yearly peak, as concerns over France's public finances increasingly weigh on the single currency. But behind the weakness of the Euro (EUR), the problem does not necessarily lie with the European economy as a whole.
Has Bitcoin really escaped the macro forces it was built to fight?
Over 17 years ago, Satoshi Nakamoto designed Bitcoin (BTC) on the back of a global financial crisis as an alternative to the global monetary system outside the control of central banks, governments and traditional intermediaries. This raises a key question: has Bitcoin really become independent of the macroeconomic forces it was built to challenge?















