The Dow Jones Industrial Average learns who paid for disinflation
- DJIA opens at its session high near 53,900 and trades near 53,700.
- July retail sales -0.6% against a 0.1% consensus, control group -0.4% from 0.4%.
- Michigan sentiment 51 from 55.2, one-year inflation expectations up to 4.3%.

Two cooling inflation readings carried the broad market to a record on Thursday, taking the S&P 500 through 7,800 for the first time, and Friday morning supplied the explanation for where the cooling came from. July retail sales contracted 0.6% against a consensus for a 0.1% gain, and preliminary August consumer sentiment landed at 51 against a 54.5 consensus. The Dow Jones Industrial Average opened at its session high near 53,900 and has not traded back to it since.
The disinflation came with an invoice
The retail sales miss was broad rather than a single soft line. Headline sales fell 0.6% where the consensus looked for a 0.1% gain, sales excluding autos fell 0.3% against a 0.2% consensus, and the control group that feeds the consumption estimate in Gross Domestic Product (GDP) fell 0.4% after a 0.4% rise the month before. A 0.7 percentage point miss on the headline is not noise around an otherwise fine quarter.
The release ninety minutes later removed any benign reading of that. Preliminary August consumer sentiment printed 51 against a 54.5 consensus and 55.2 in July, roughly 8% lower on the month and unwinding two months of improvement in one go, while the expectations component dropped to 50.6 from 55.4. One-year inflation expectations went the other way, up to 4.3% from 4.2%. Spending contracted, confidence broke, and the price expectations that are supposed to fall alongside them rose instead.
The curve took the print seriously
Short-dated Treasuries did the honest work of the session. The two-year yield traded briefly beneath 4.10%, its lowest since June 30, as the September rate-hike case that sat at roughly even odds midweek lost another leg. Ten- and thirty-year yields sat marginally higher on the day, so this was a front-end repricing rather than a growth scare marked across the whole curve.
A steeper curve on a weak consumer print carries a specific message. It says the Committee will be halted by demand before it is satisfied on inflation, which leaves the inflation risk parked with whoever owns the long bond. Equity investors spent Wednesday and Thursday treating softer prints as permission, and the front end spent Friday treating the same prints as evidence that the permission was expensive.
The bull case needs the strait shut
The year-end index targets circulating this week rest on an unusually specific set of conditions: earnings growth holding near current levels, the Federal Reserve staying on hold, and Crude Oil above the $80.00 handle with the Strait of Hormuz still shut. That last condition deserves a second reading, because the bullish equity case is now an explicit bet that the war continues rather than an argument that it ends.
The physical arithmetic behind that bet is eroding. The International Energy Agency (IEA) warned on Wednesday that a reopening is becoming urgent as the world draws down its stockpiles, with roughly 8.3 million barrels a day of Gulf output still shut in and global supply running 6.3 million barrels a day beneath year-ago levels. US Crude Oil inventories have dropped below 300 million barrels for the first time in more than four decades.
Brent trades near $87.00 and West Texas Intermediate (WTI) near $81.50, which looks calm until the source of the calm is named. The diplomacy went backwards this week, with the president repeating on Wednesday that Washington has total control of the waterway, Tehran answering that the claim rests on intelligence failures, and the Revolutionary Guard restating that no vessel passes without its permission. A barrel held down by inventories nobody can replace is not the same asset as a barrel held down by peace.
What next week has to answer
The calendar hands the argument straight to the companies that sell to the consumer who just stopped spending. Home Depot (HD) reports on Tuesday and Walmart (WMT) on Thursday, both from inside the index, both covering the quarter this retail sales series has now marked down. Housing starts and building permits land on the same Tuesday against 1.427 million and 1.374 million priors, alongside the four-week average of the private employment gauge at an 8.25K prior, down from 15K a month earlier.
The Federal Open Market Committee (FOMC) minutes from the July meeting publish on Wednesday at 18:00 GMT, covering the first three-way dissent in one direction since 2016, and Friday brings preliminary August Purchasing Managers Index (PMI) readings against 53.9 manufacturing and 54.6 services priors. Between those two sits the question this session opened, which is whether the disinflation the market bought is the supply side healing or the demand side failing.
Levels
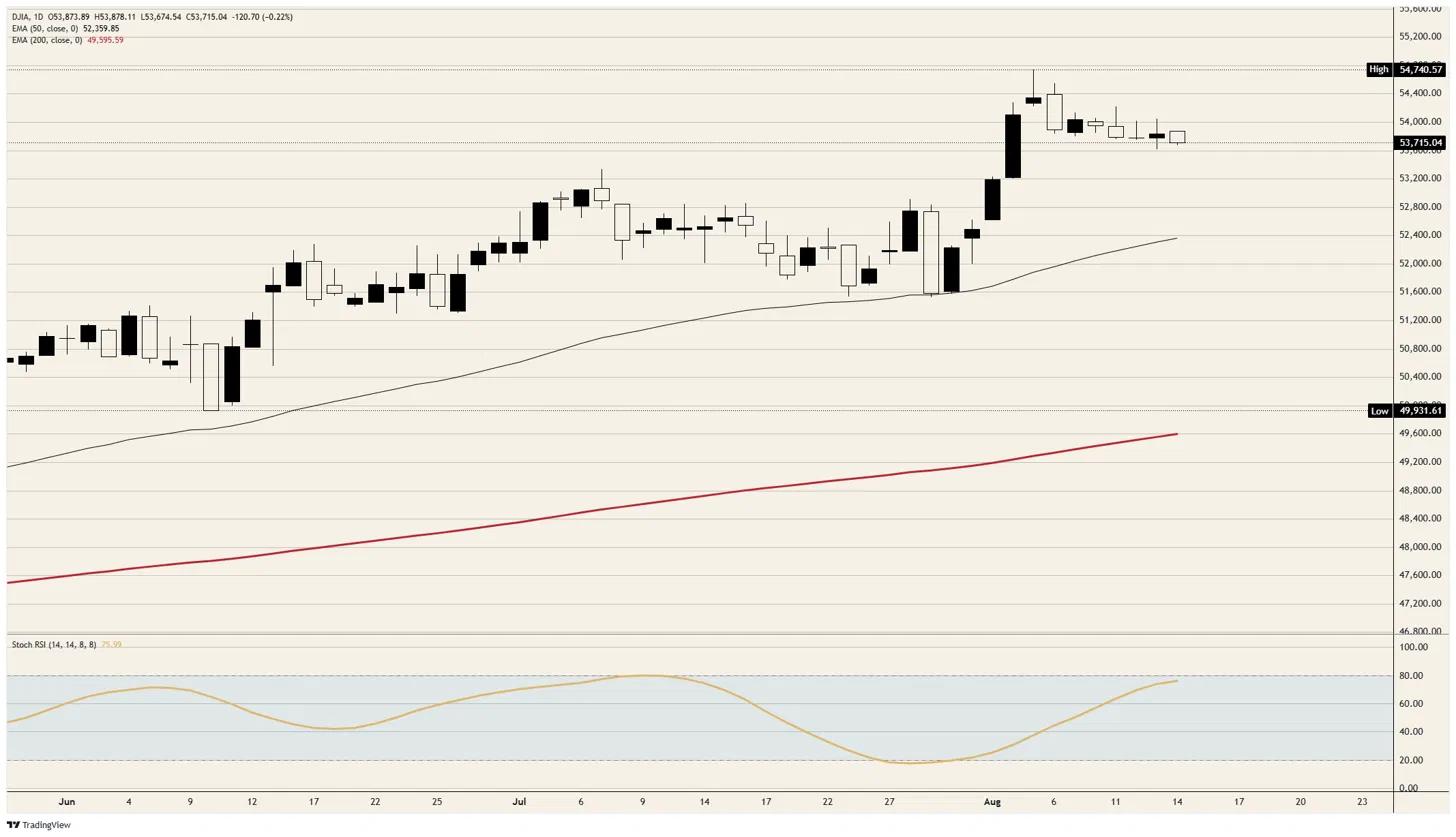
Resistance: The 53,800 area is the first line, a shelf the index has defended since early August and one that now caps from above, with 53,900 marking the session opening high. Above that, 54,100 is the early-August ledge and the record just short of 54,750 is the ceiling on the chart. The daily Stochastic Relative Strength Index (Stoch RSI) near 76 has climbed into the upper band without the index making a new high, which is momentum with no price to show for it.
Support: The 53,700 area holds the session low, and a break beneath it opens 53,500, the first level with real work behind it. Below that the tape thins toward 53,200, the launchpad for the early-August advance, with nothing structural until the rising 50-day Exponential Moving Average (EMA) near 52,400.
Bias: Bearish while the 53,800 area caps. An index that opens at its session high and cannot trade back to it, on a data set that questions the week's entire premise, is distributing rather than digesting. Objectives 53,500 then the 53,200 area, invalidation on a daily close back above 53,900.
Dow Jones daily chart
Dow Jones FAQs
The Dow Jones Industrial Average, one of the oldest stock market indices in the world, is compiled of the 30 most traded stocks in the US. The index is price-weighted rather than weighted by capitalization. It is calculated by summing the prices of the constituent stocks and dividing them by a factor, currently 0.152. The index was founded by Charles Dow, who also founded the Wall Street Journal. In later years it has been criticized for not being broadly representative enough because it only tracks 30 conglomerates, unlike broader indices such as the S&P 500.
Many different factors drive the Dow Jones Industrial Average (DJIA). The aggregate performance of the component companies revealed in quarterly company earnings reports is the main one. US and global macroeconomic data also contributes as it impacts on investor sentiment. The level of interest rates, set by the Federal Reserve (Fed), also influences the DJIA as it affects the cost of credit, on which many corporations are heavily reliant. Therefore, inflation can be a major driver as well as other metrics which impact the Fed decisions.
Dow Theory is a method for identifying the primary trend of the stock market developed by Charles Dow. A key step is to compare the direction of the Dow Jones Industrial Average (DJIA) and the Dow Jones Transportation Average (DJTA) and only follow trends where both are moving in the same direction. Volume is a confirmatory criteria. The theory uses elements of peak and trough analysis. Dow’s theory posits three trend phases: accumulation, when smart money starts buying or selling; public participation, when the wider public joins in; and distribution, when the smart money exits.
There are a number of ways to trade the DJIA. One is to use ETFs which allow investors to trade the DJIA as a single security, rather than having to buy shares in all 30 constituent companies. A leading example is the SPDR Dow Jones Industrial Average ETF (DIA). DJIA futures contracts enable traders to speculate on the future value of the index and Options provide the right, but not the obligation, to buy or sell the index at a predetermined price in the future. Mutual funds enable investors to buy a share of a diversified portfolio of DJIA stocks thus providing exposure to the overall index.
Author

Joshua Gibson
FXStreet
Joshua joins the FXStreet team as an Economics and Finance double major from Vancouver Island University with twelve years' experience as an independent trader focusing on technical analysis.
















