|

Taiwan Semiconductor (TSM) aiming for a break above $500

Taiwan Semiconductor (NYSE: TSM) maintains its bullish cycle from the 2022 low. Bulls continue to seek further upside extension. In today’s article, we examine the current Elliott Wave structure unfolding. Our analysis highlights the potential for higher targets ahead.

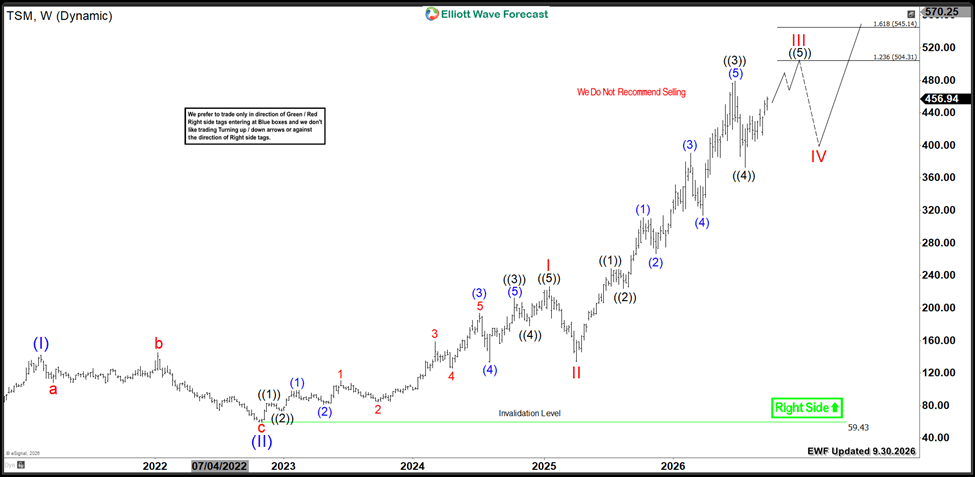
TSM shows an impulsive advance from its 2022 low. Wave I peaked at $226, followed by a wave II pullback to $134. Currently, wave III remains in progress and enters its final stage. The internal cycle of this rally also shows a three-wave advance. Wave ((3)) ended at $479. Then, a pullback in wave ((4)) reached $372 in August 2026.

As long as this low holds, the stock should continue rallying in wave ((5)). It will target the $504 – $545 area. That zone will likely see some profit-taking. It could also mark the wave III peak. Following that, another pullback will occur within wave IV. Then, the rally will resume again.

Consequently, TSM’s weekly cycle remains supported to the upside. The bullish sequence suggests further extension. Buyers will keep seeking entries within daily pullbacks. These will form as 3, 7, or 11 swings within the main trend.

TSM weekly chart 9.30.2026
Chart

Author

Elliott Wave Forecast Team

Elliott Wave Forecast Team

ElliottWave-Forecast.com

More from Elliott Wave Forecast Team
Share:

Editor's Picks

AUD/USD accelerates the decline below 0.7000

The late rebound in the Greenback has prompted the AUD/USD’s selling pressure to gather extra steam on Wednesday, sending spot to the mid-0.6900s for the first time since late July. In addition, inflation figures in Oz failed to surprise markets, leaving the pair vulnerable to extra weakness. On Thursday, the focus of attention on the domestic calendar will be on the release of the trade balance results in August.

USD/JPY stays weak below 157.00 amid Japanese intervention risks

USD/JPY keeps losses below 157.00 in the Asian session on Wednesday, as hawkish BoJ expectations, along with intervention risks, underpin the Japanese Yen, countering dismal domestic factory output and retail sales data. Meanwhile, a broad US Dollar retreat also collaborates to the pair's downside.

Gold meets resistance just above $4,200

Gold now makes a U-turn and recedes toward the $4,150 region per troy ounce on Wednesday. Indeed, the precious metal fades the earlier move past the key $4,200 yardstick and retreats marginally as the US Dollar trims part of its daily losses amid mixed US Treasury yields.

Bitcoin and Gold Outlook: BTC recovers $84K, XAU slips amid softer US PCE
Bitcoin (BTC) gains traction, rising above $84,000 on Wednesday as buyers return after softer-than-expected United States (US) inflation data. The Crypto King marks a second straight day of gradual recovery, building on the demand area between $82,000 and $83,000. Gold (XAU/USD), meanwhile, slides toward $4,100 after being rejected at the daily high of $4,219.
The Euro is near a one-year low: Inflation could trigger its rebound, not its fall

EUR/USD has fallen to its lowest level since May 2025, but a fresh inflation shock in the Eurozone could give the Euro an unexpected lifeline. The pair hit 1.1312 on Wednesday and trades well below the January peak of 1.2082. The decline reflects a powerful combination of US Dollar strength, geopolitical uncertainty and renewed concerns about Europe's exposure to higher energy prices.

The Euro is near a one-year low: Inflation could trigger its rebound, not its fall

EUR/USD has fallen to its lowest level since May 2025, but a fresh inflation shock in the Eurozone could give the Euro (EUR) an unexpected lifeline. The pair hit 1.1312 on Wednesday and trades well below the January peak of 1.2082.















