S&P 500 (US500) multi-dimensional structural breakdown

Executive summary
The US S&P 500 Index (US500) is currently navigating a high-density structural compression corridor within the proprietary SMAS 3D (Shved Market Analysis System) quantum matrix. Price action at 7677.00 is compressed between an impenetrable 9th-Order Macro Supply Ceiling (9TF) overhead and an institutional 6th-Order Demand Foundation (6TF) below.
Our multi-timeframe telemetry confirms that while higher timeframes exhibit localized equilibrium, intermediate tactical vectors on the 30-Minute framework have accelerated downward with a Structure Engine Slope of minus nineteen point seven degrees. The rejection off the intermediate 6TF supply barrier at 7695.00 sets up an institutional rotation toward the lower 2-sigma boundary of the 3D Quantum Tunnel at 7626.50.
Master execution analysis: The 9TF super-massif (US500 H1)
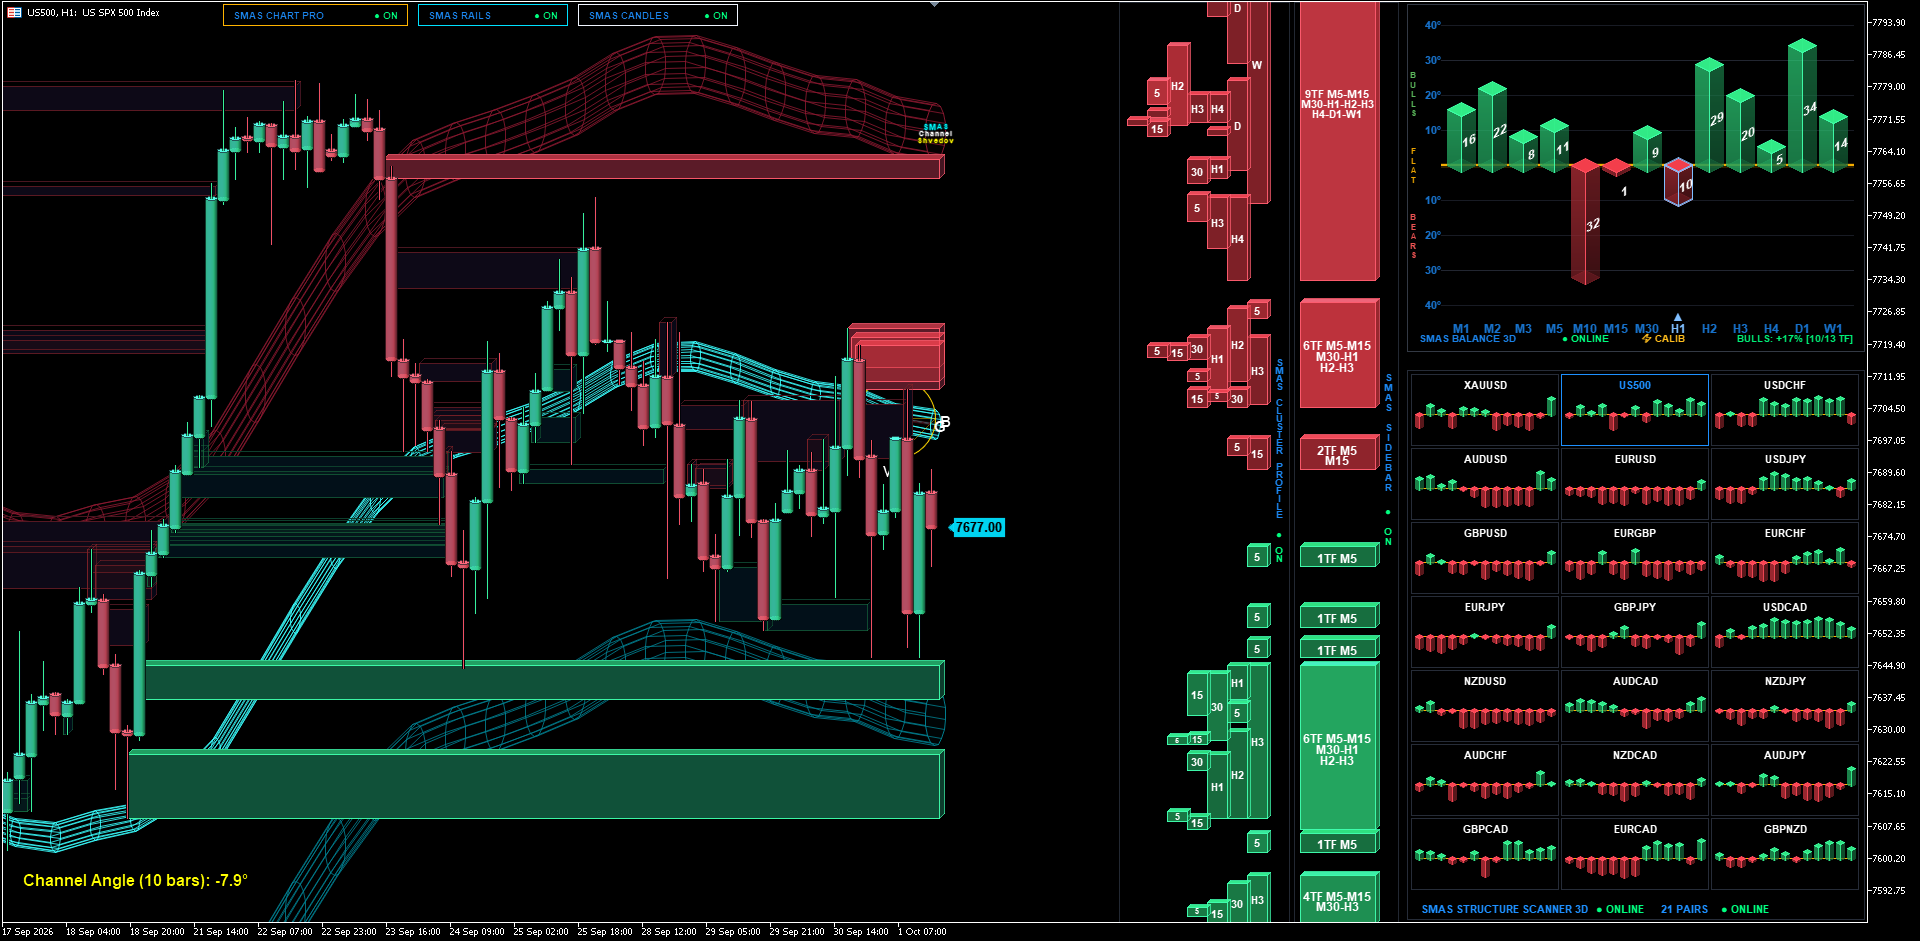
Decomposing the structural hierarchy on the Master Execution Chart reveals a distinct multi-layer order book architecture. Capping the macro horizon is a legendary 9th-Order Supply Super-Cluster (9TF: M5-M15-M30-H1-H2-H3-H4-D1-W1) situated in the 7770.00 to 7800.00 region. This monolithic massif aligns nine independent time horizons, proving that long-term institutional capital has established an absolute structural distribution ceiling.
Directly above the current equilibrium at 7677.00 lies an intermediate 6TF supply barrier (M5-M15-M30-H1-H2-H3) spanning 7695.00 to 7715.00. The Structure Engine ordinary least squares regression axis on the 1-Hour chart confirms an active downward tilt of minus seven point nine degrees. While the Structure Balance 3D tensor registers a temporary green relief pressure on higher horizons, micro-momentum on M10 at minus thirty-two percent and H1 at minus ten percent confirms that overhead supply continues to absorb upward liquidity sweeps.
Tactical volumetric tunnel and 30-minute vector (H1/M30/M15)
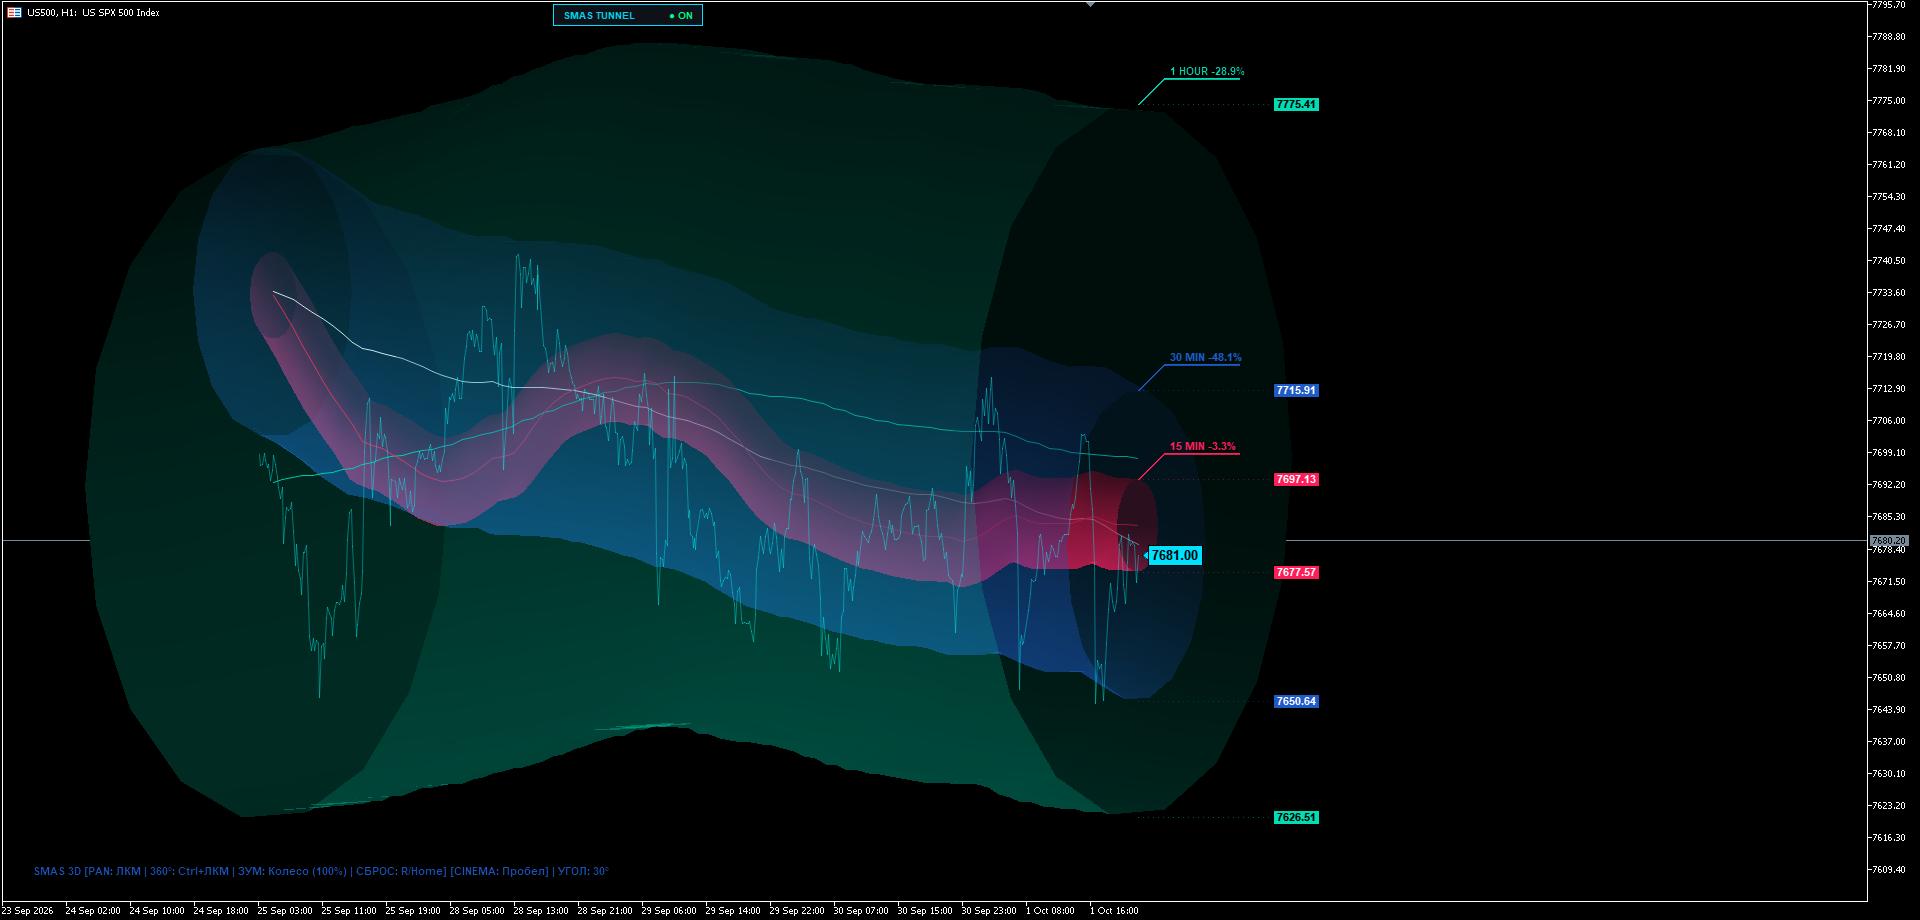
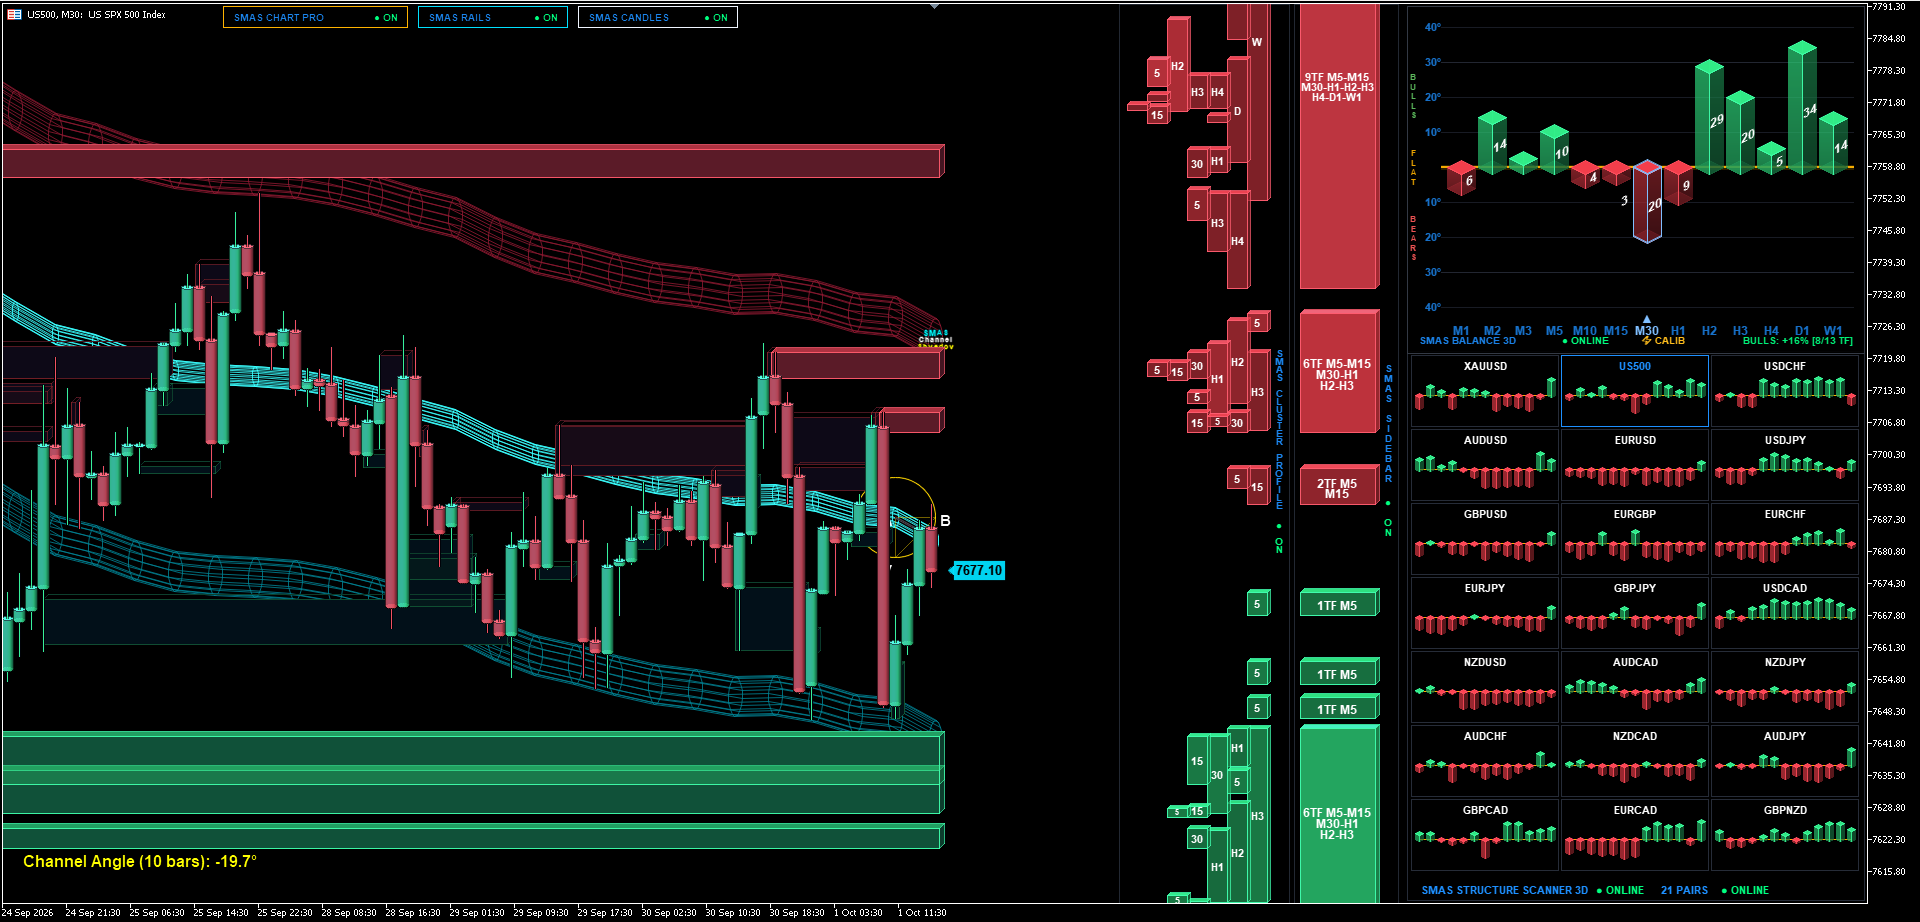
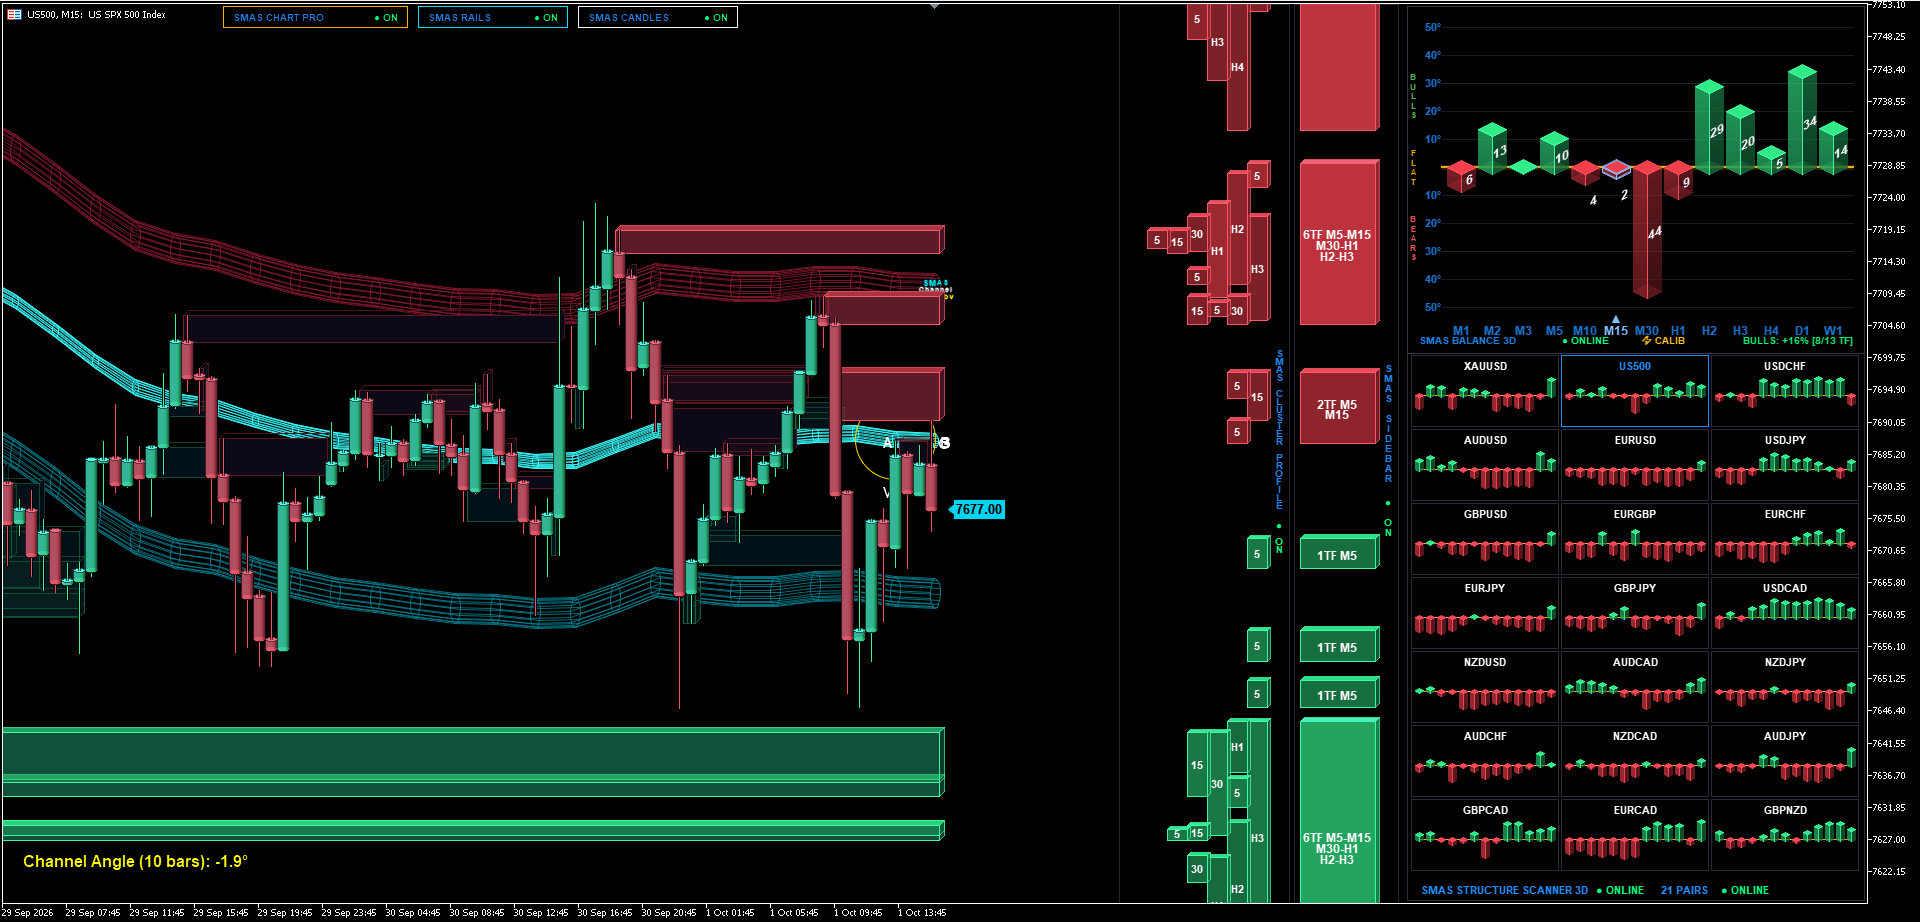
The 3D Quantum Volumetric Tunnel provides exact spatial coordinates for the current energy conduit. Front-cap telemetry displays multi-period velocity with the 1-Hour vector at minus fifteen point five percent targeting 7775.41 above and 7626.51 below. The 30-Minute tactical stream shows a sharp downward acceleration with a Structure Engine Channel Angle of minus nineteen point seven degrees.
Price at 7676.50 is currently testing the inner core boundary. The exhaustion of the upward retracement against the 6TF supply barrier establishes a high-probability rotation through the internal conduit, targeting the terminal 2-sigma green demand floor at 7650.64 and 7626.51.
Mathematical execution protocol (Tactical range rotation short)
Trading the structural rejection off the intermediate 6TF Supply barrier toward the 6TF Demand floor:
Execution Setup: Shorting the exhaustion of the relief bounce into the intermediate 6TF Supply Cluster.
Entry Zone (Short): 7688.00 — 7705.00 (Test of 6TF Supply Base and 3D Tunnel Upper Core).
Stop Loss (Invalidation): 7730.00 (Above intermediate supply structure, risk 25 points).
Take Profit 1 (50% Volume): 7650.00 (Median 3D Tunnel boundary, +38 points, Move SL to BE).
Take Profit 2 (Terminal Target): 7626.50 (Lower 2-sigma green demand floor of 3D Tunnel, +62 points).
Asymmetric Risk / Reward: 1 : 2.5 (High-Probability Institutional Range Rotation).
Author

Andrey Shvedov
SMAS Quantum Research
Andrey Shvedov is an active quantitative trader, software architect, and financial market researcher with over 24 years of live market microstructure experience.