S&P 500 (SPX) pushing toward fresh highs in wave ((v)) [Video]
![S&P 500 (SPX) pushing toward fresh highs in wave ((v)) [Video]](https://editorial.fxsstatic.com/images/i/SP500-bullysh-withoutbull.jpg)
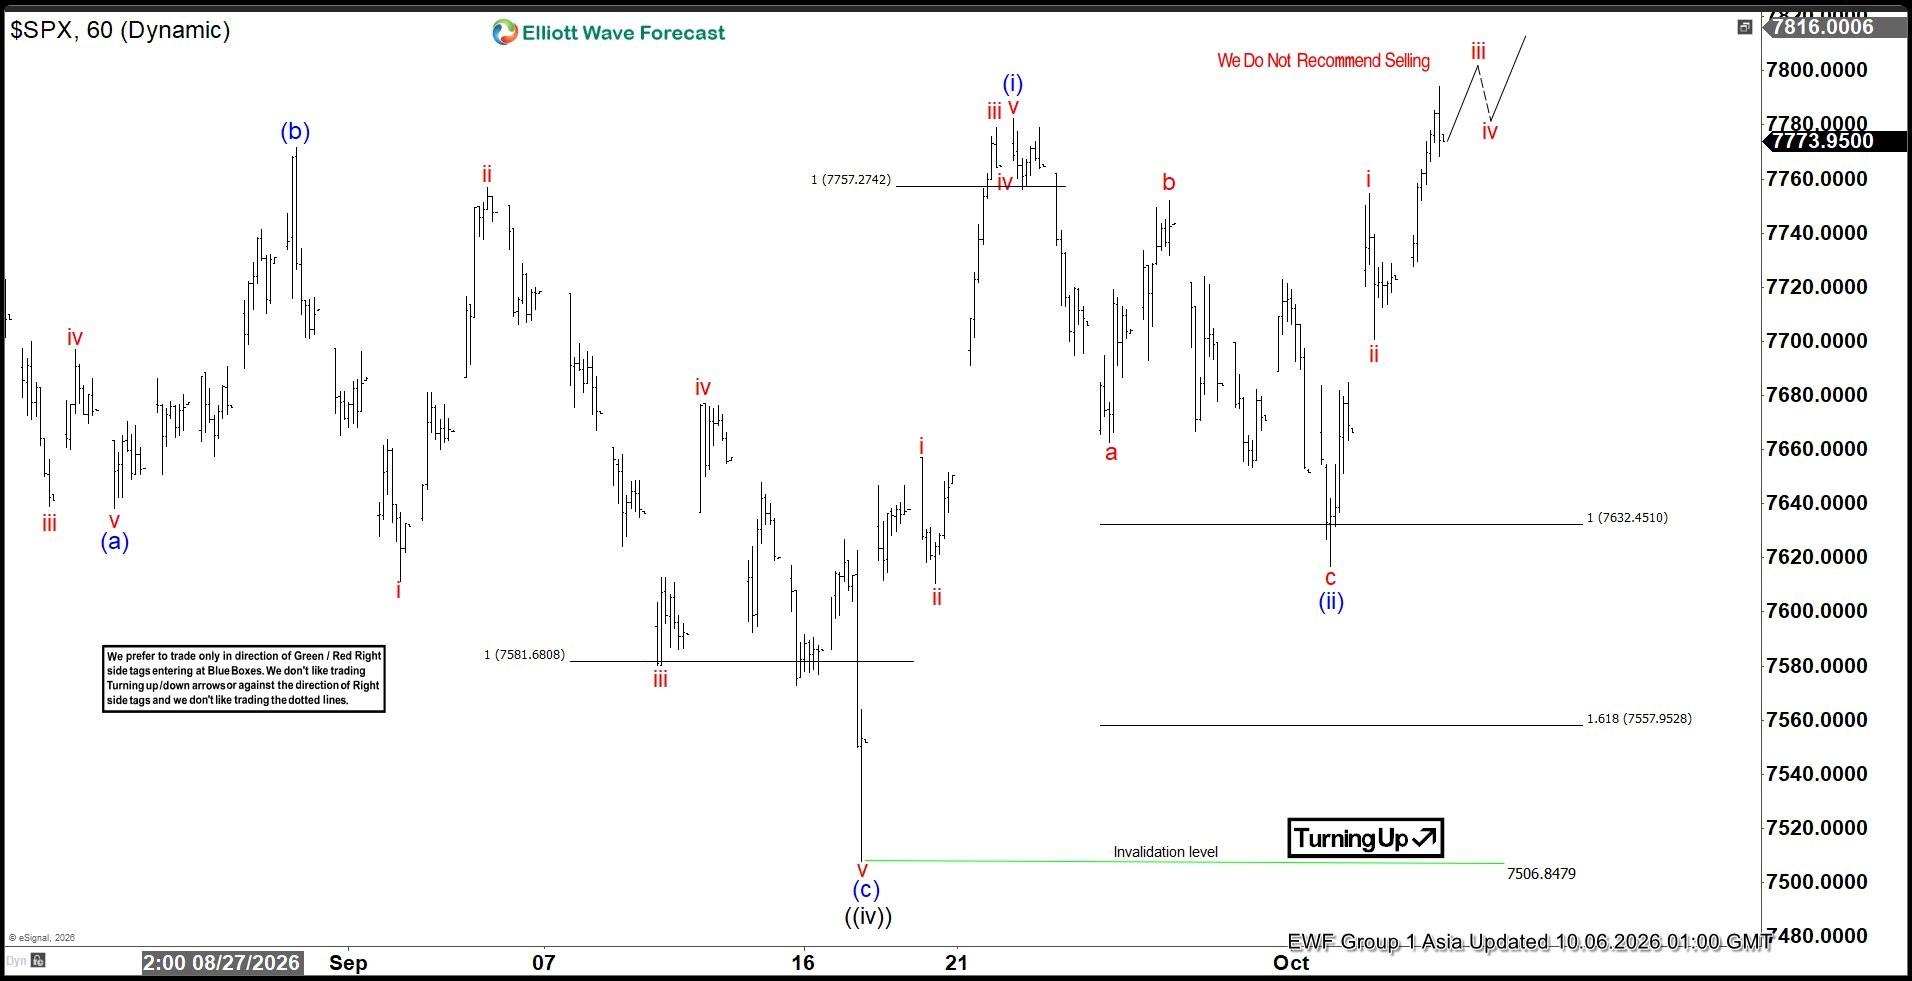
The short-term Elliott Wave view in the S&P 500 (SPX) indicates that the cycle from the March 30, 2026 low remains active, unfolding as a five-swing diagonal structure. From that low, wave ((i)) concluded at 7620.9, followed by a corrective decline in wave ((ii)) which ended at 7237.85. The Index then resumed its upward trajectory, advancing in wave ((iii)) toward 7816.7. Subsequently, a pullback in wave ((iv)) developed as a zigzag formation, completing at 7506.84, as reflected in the one-hour chart.
The Index has since turned higher again in wave ((v)), which is internally subdividing into a clear five-wave structure. From the termination of wave ((iv)), wave (i) advanced to 7782.19. The ensuing pullback in wave (ii) found support at 7616.78. In the near term, as long as the pivot at 7506.84 remains intact, dips are expected to attract buyers. These retracements should ideally unfold in either three or seven swings, consistent with Elliott Wave guidelines, before resuming higher levels. The overall structure implies that the bullish cycle from March 30 is not yet complete, and further upside remains probable as long as key supports hold firm. This reinforces the view that the Index is progressing within a mature but still developing diagonal sequence, with the potential to extend gains before a larger corrective phase emerges.
S&P 500 (SPX) 60-minute Elliott Wave chart
SPX Elliott Wave [Video]
Author

Elliott Wave Forecast Team
ElliottWave-Forecast.com