S&P 500 outlook: Using Elliott Wave analysis to spot key market turning points

In the June 3 update, when the S&P 500 (SPX) was trading at around $7,570, it was shown, using the Elliott Wave Principle combined with market breadth, that “the weight of the evidence points toward a large-degree decline that could last several months.”
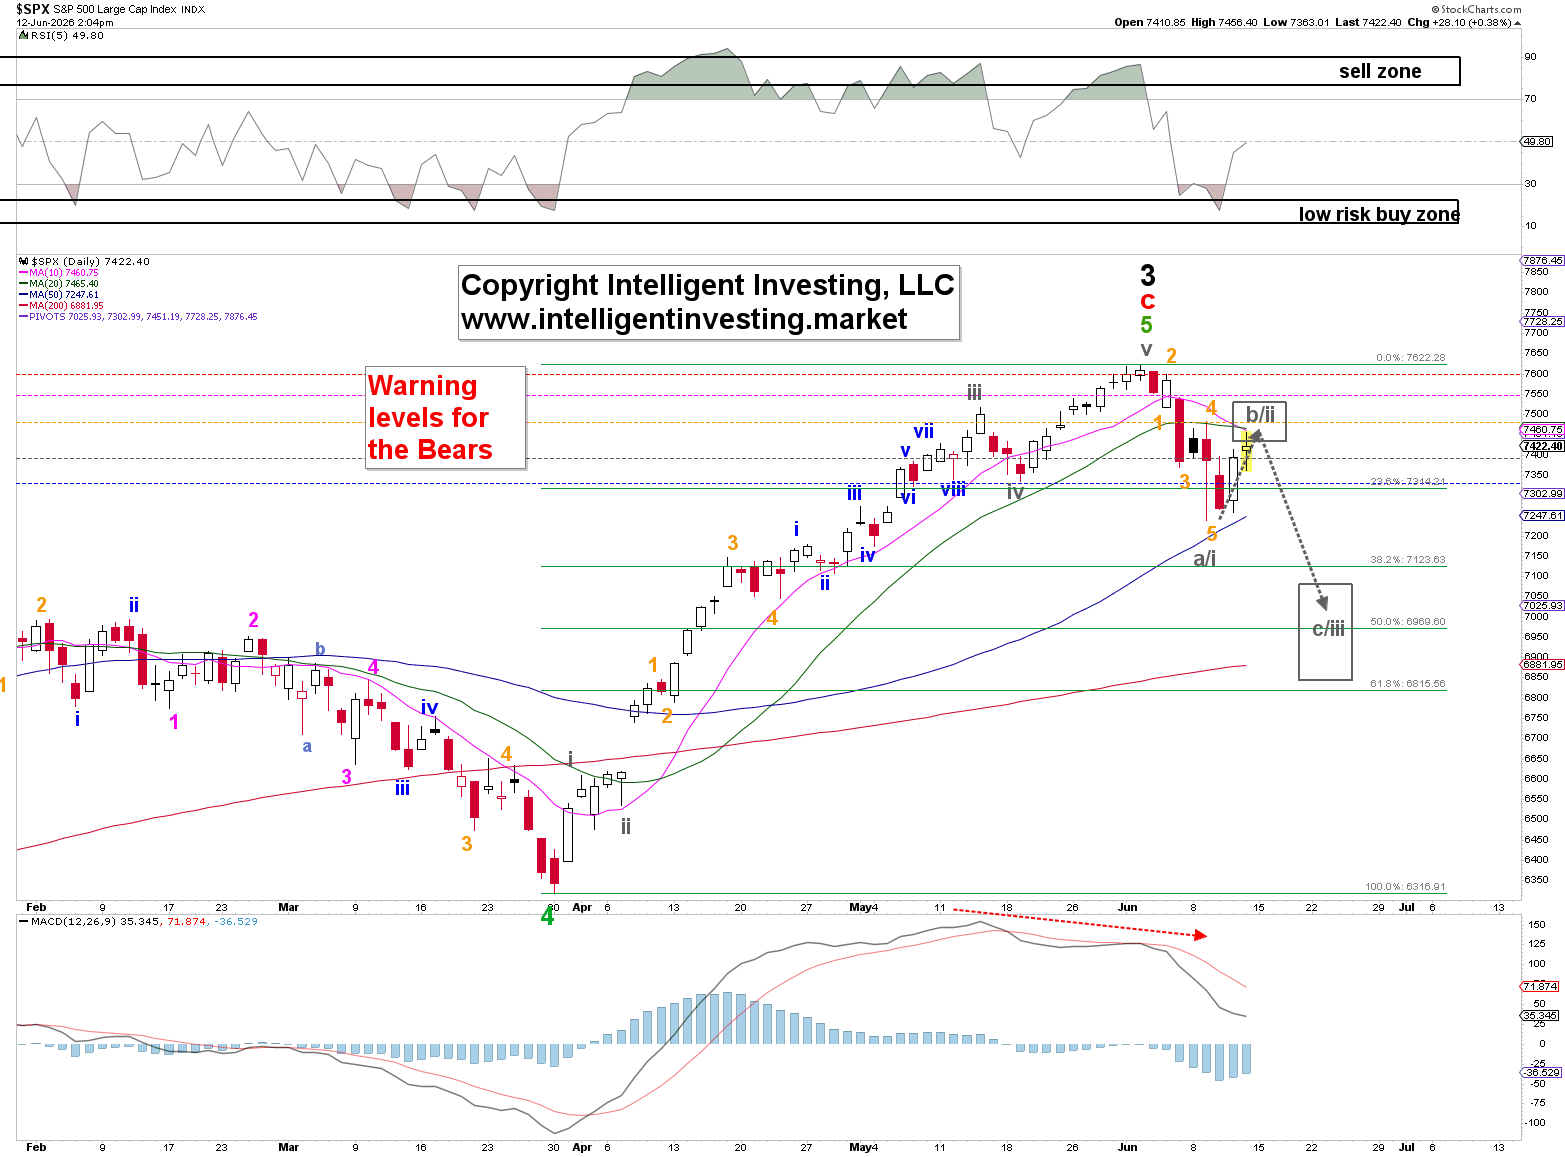
Fast-forward to today: the index fell to $7,237 on Tuesday and has since rallied to $7,456. So far, so good. We now expect the next leg lower to $6,840-7,075, depending on the Fibonacci relationship: (gray) c/iii = 1.618x a/i to c/iii = a/i. This assumes the index holds below $7,598. See Figure 1 below.
Figure 1. Short-term Elliott Wave count with technical indicators for the SP500
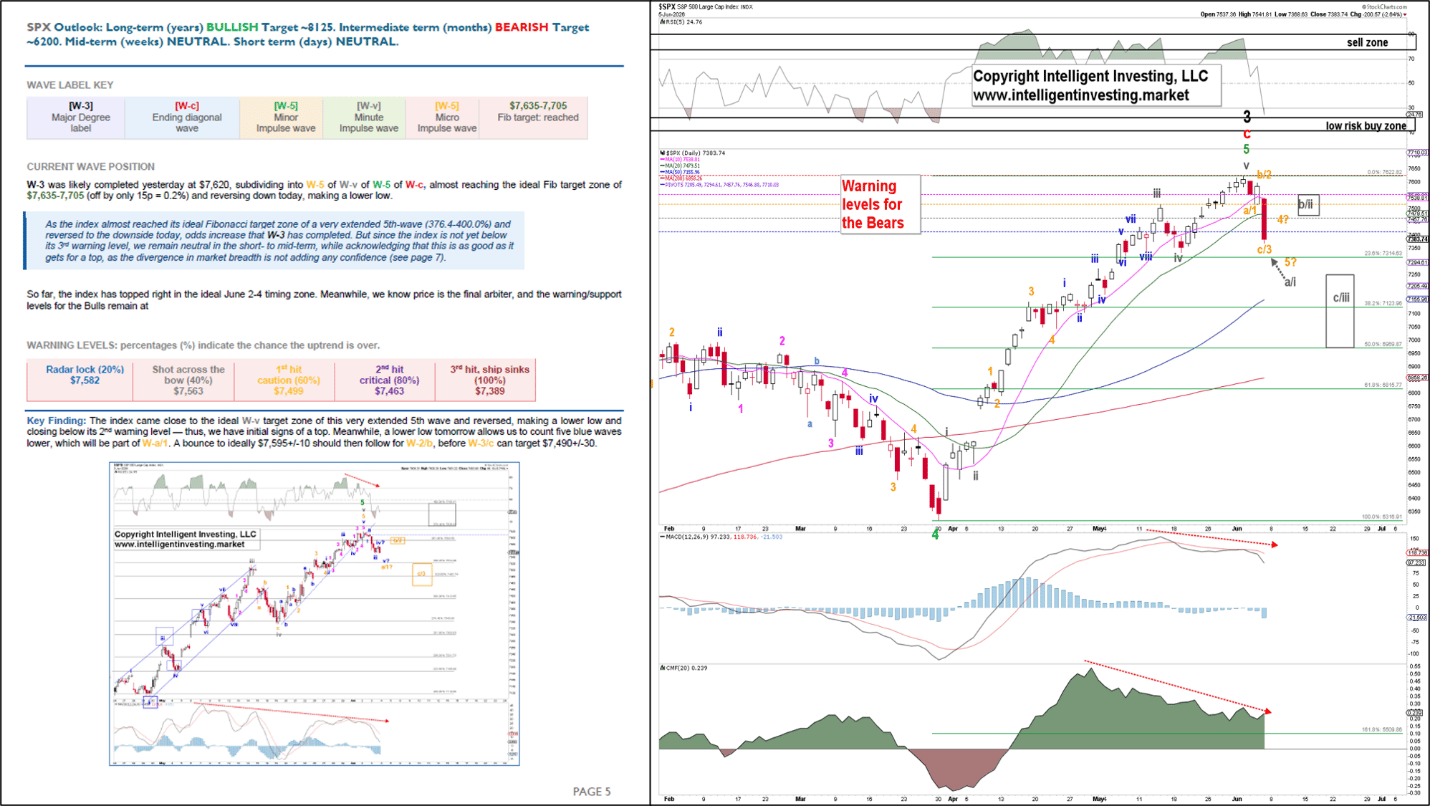
With the intermediate-term picture in place, I wanted to share how the index has been correctly tracked over the past weeks to demonstrate the EWP's accuracy and reliability. Specifically, in Wednesday’s June 3 Newsletter, it was forecasted that
“A lower low tomorrow allows us to count five blue waves lower, which will be part of W-a/1. A bounce to ideally $7,595+/-10 should then follow for W-2/b, before W-3/c can target $7,490+/-30.”
The index opened lower on June 4 at $7,516, rallied to $7,598 that same day, and then dropped to $7,368 on June 5. The latter target was slightly below expectations, as the index moved beyond the more common 161.80% extension for a 3rd/C-wave. However, direction is far more important than a 1.2% small miss in magnitude. Thus, so far, that’s three for three. See Figure 2 below.
Figure 2. June 3 Newsletter Forecast vs Actual Market Performance by June 5
With three waves lower, it remained uncertain whether a 4th wave up and a 5th wave lower would develop. Regardless, “After three waves lower, always expect at least three waves back up.” The index gave us three waves up, with an up day on June 8 and a reversal on June 9, thereby completing five (orange) waves lower: see Figure 1.
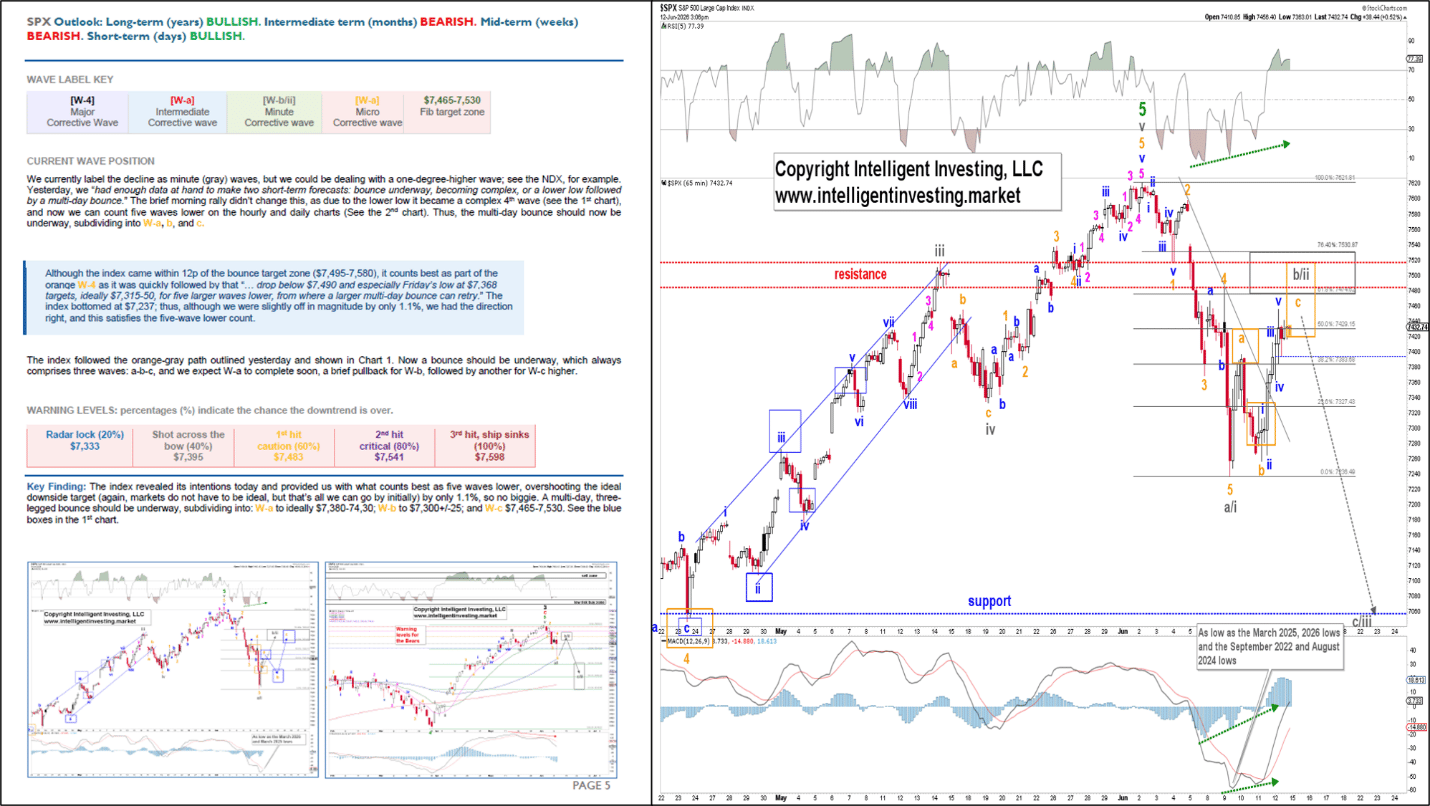
With five (orange) waves lower on the books, our lives were made easier again, as we know from the EWP that a three-wave bounce - gray W-b/ii - must be expected, followed by another leg lower: gray W-c/iii. So, in the June 9 Newsletter, see Figure 3 below, a multi-day a-b-c corrective bounce was expected with these precise targets:
→ (Orange) W-a to $7,380-7,430 (reached $7,396 on Wednesday)
→ (Orange) W-b to $7,300 +/-25 (reached $7,257 on Thursday)
→ (Orange) W-c targeting $7,465-7,530 (reached $7,456 so far; today’s high)
So far, the textbook three-wave corrective bounce unfolded right into the zones we outlined. Again, that’s three for three.
Figure 2. June 9 Newsletter Forecast vs Actual Market Performance by June 12
The point is that, when used correctly, the EWP allows us to look around several corners at once, providing remarkable foresight and a clear advantage. In addition, the EWP proves that financial markets exhibit predictable patterns, allowing us to participate with greater confidence. While there will always be periods of uncertainty, such as the “would a 4th wave up and a 5th wave lower develop?” question, once we do get five waves lower, the next several moves are highly predictable with uncanny precision.
Of course, there will be times when an analyst is wrong, but expecting perfection in an imperfect world is a recipe for (portfolio) disaster. However, one simply course-corrects by reassessing price action. When the index follows well-defined EWP patterns, as it does now, the next big-to-small moves are relatively straightforward, giving market participants an edge and a plethora of low-risk/high-reward entry and exit levels, i.e., the target zones.
Author

Dr. Arnout Ter Schure
Intelligent Investing, LLC
After having worked for over ten years within the field of energy and the environment, Dr.


