S&P 500 outlook: Dive to 6,500 or lower? [Video]
![S&P 500 outlook: Dive to 6,500 or lower? [Video]](https://editorial.fxsstatic.com/images/i/Equity-Index_S&P500-1.jpg)
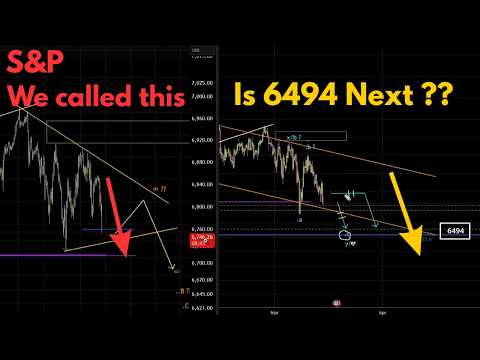
In this analysis, we revisit our earlier outlook on the S&P 500 that was shared in advance when the index was trading near the 6746 level. At that stage, the wave structure suggested a clear bearish bias, indicating the potential for a downward move to unfold in the sessions ahead.
Since then, price action has progressed broadly in line with the anticipated Elliott Wave pathway. The market declined from the 6746 zone toward the 6600 region, reinforcing the structural view that was discussed earlier. This development provides a practical illustration of how structured technical frameworks can help traders track evolving market direction and manage expectations more effectively.
The discussion also reviews chart-based observations made during the earlier stages of the move, highlighting how the downside pathway was identified and monitored as the market developed step-by-step.
What Is the Current Wave Structure Suggesting?
From the broader reference high near 7011, the index appears to be forming a complex corrective pattern. The working assumption is a W/A – X/B – Y/C structure, suggesting that the final leg of the correction — the C wave — may still be pending.
If this interpretation continues to unfold, a sustained move below the 6575 level could open the door for further downside extension toward the 6494 region, which currently stands out as an important structural reference.
Two Possible Market Pathways
Based on the present wave configuration, two primary scenarios are being monitored:
Scenario 1: Direct Impulsive Decline
The index may move sharply lower in a relatively straight fall toward projected downside levels, reflecting strong bearish momentum.
Scenario 2: Sideways Consolidation Before the Next Leg Down
Alternatively, the market could enter a period of sideways corrective movement — potentially forming a flat or triangle-type structure — before initiating the next downward leg.
Recognizing which pathway is unfolding can help traders stay aligned with market structure rather than reacting emotionally to short-term volatility.
Final Perspective
Wave-based market analysis is less about rigid prediction and more about preparing for probable pathways within a structured framework. By continuously comparing real-time price action with pre-defined scenarios, market participants can refine their positioning and risk management decisions as conditions evolve.
For a deeper understanding of the chart structure and scenario planning discussed here, readers may refer to the accompanying video analysis.
Author

Neerav Yadav
50 Eyes Market Analysis
Neerav Yadav is a Futures trader who is in the markets since 2014 and trades primarily in Energy Futures, Gold, Indices, Stocks and other instruments.


