Skydance stock slides 7% despite Q3 earnings beat
- Skydance's adjusted earnings per share (EPS) of $0.45 beat the $0.18 consensus, while revenue of $7.03 billion came in just short of estimates.
- BofA Global Research keeps an Underperform rating and a $9 price objective, warning of a long integration.
- Buyers defend the $7.75 area, where Tuesday's low meets the 20-day SMA.

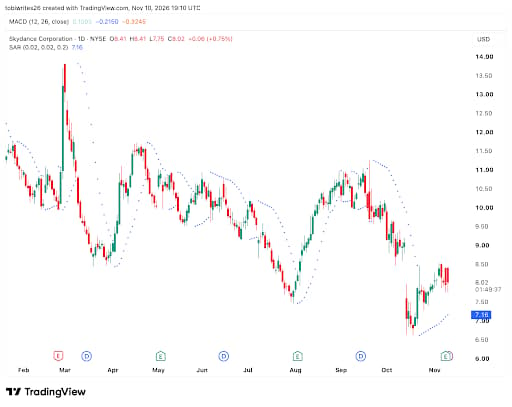
Skydance Corp (SKYD) trades near $8.06 in the American session on Tuesday, down 7.4% at the time of writing, according to TradingView data. The stock opened at $8.41 and fell to a low of $7.75, wiping out most of Monday's 8.6% gain to $8.70, before results landed after the close.
Skydance stock news
BofA Global Research analyst Jessica Reif Ehrlich kept an Underperform rating and $9 price objective in a November 10 client note, warning of "a daunting integration that will take a significant amount of time." The target assumes about 7x pro forma 2028 enterprise value to Earnings Before Interest, Taxes, Depreciation and Amortization (EV/EBITDA), a discount to peers that reflects high leverage and execution risk.
Paramount's standalone adjusted EBITDA of $1.0 billion beat BofA's $925 million estimate, though TV Media advertising fell 8% year over year to $1.34 billion. Moving to pro forma numbers, BofA raised its 2026 EPS estimate to $0.75 from $0.49 but cut 2027 to $0.13 from $0.68 and 2028 to $0.58 from $0.84.
Revenue rose 5% to $7.03 billion, slightly below the $7.07 billion consensus, while adjusted EPS of $0.45 topped the $0.18 estimate, according to MarketBeat. Paramount+ revenue grew 21%, Skydance said in its shareholder letter. Management warned that Warner Bros. films could cut fourth-quarter Studios profit by up to $200 million. Gross debt now stands near $87 billion against about $10 billion of cash, and the company targets net leverage of 3.0x by the end of 2029.
Next up are pro forma financials before the fourth-quarter call, Dune: Part Three on December 18, and a Paramount+ and HBO Max bundle in early 2027.
Skydance stock forecast
On the daily chart, SKYD is still rebuilding after the October 14 drop from $9.27 to $7.06 and the October 19 low at $6.61. Price holds above the 20-day Simple Moving Average (SMA) at $7.74 but below the 50-, 100- and 200-day SMAs at $9.05, $9.16 and $9.76. The Relative Strength Index (RSI) near 46 and an Average Directional Index (ADX) of 18 point to a weak trend, while the Moving Average Convergence Divergence (MACD) line stays below zero.
On the 4-hour chart, SKYD hovers around its 20-period SMA at $8.06 and holds above the 50-period SMA at $7.94, with RSI near 49 leaving the short-term picture neutral.
Initial support is at 7.74-7.75, where Tuesday's low meets the 20-day SMA and the 4-hour S1 pivot. A daily close below it could expose $7.40 (October 28) and $7.27 (October 26), while only a return toward $6.61 would seriously threaten the October recovery.
On the upside, Tuesday's $8.41 high comes first, then Monday's $8.70 close and $8.80 high. BofA's $9.00 target and the 50-day SMA at $9.05 could cap any rebound while price stays below the longer averages.
Support levels: $7.75, $7.40, $7.27
Resistance levels: $8.41, $8.80, $9.05
SKYD daily chart
Author

Tobi Opeyemi Amure
Independent Analyst
Tobi Opeyemi Amure, CFEI®, is a markets journalist who has spent seven years following the money across stocks, payments, AI, and crypto. His reporting has appeared in Investopedia, TheStreet, Benzinga, Inc., FinanceFeeds, and DailyForex.