Silver Price Forecast: XAG/USD tumbles after hitting 12-year peak, bearish engulfing looms
- Silver price drops sharply, erasing Tuesday's gains, driven by profit-taking and a rise in US Treasury yields.
- A daily close below $33.78 could confirm a ‘bearish engulfing’ pattern, signaling potential for deeper pullback to $32.95 and $32.51.
- For a bullish continuation, buyers need to reclaim the $34.00 level and retest the year-to-date high at $34.86.

Silver price retreats after posting a multi-year high at $34.86, yet erases more than Tuesday’s gains, and is down over 3.30 percent. At the time of writing, the XAG/USD trades at $33.66, sponsored by higher US Treasury yields and a strong US Dollar.
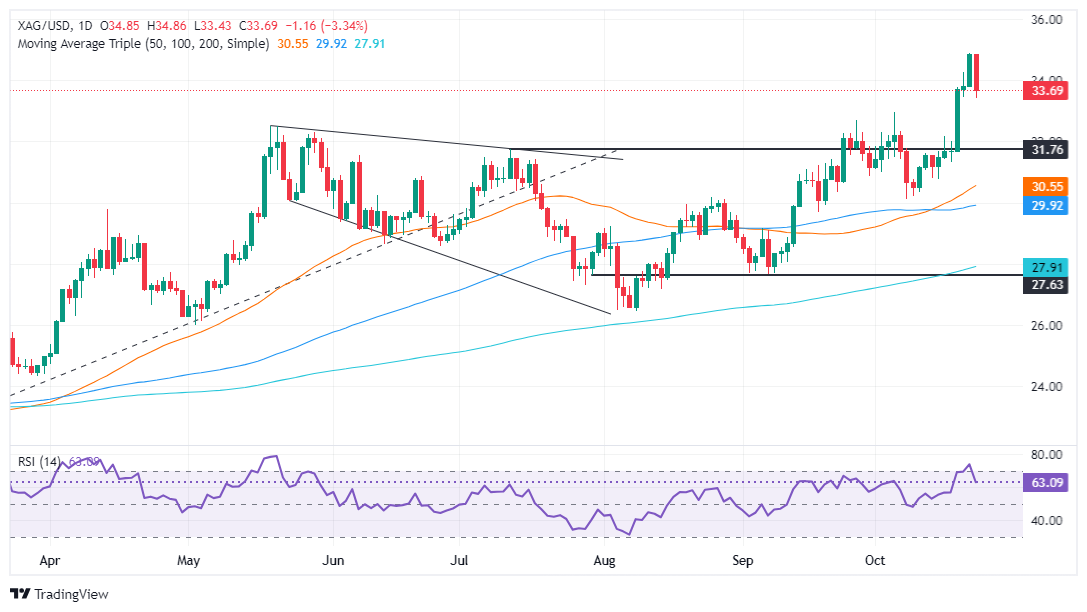
XAG/USD Price Forecast: Technical outlook
Silver price reversed its course on Wednesday, after printing 12-year peak. The Relative Strength Index (RSI) tumbled after reaching overbought conditions, an indication that longs were booking profits. Sellers moved in and capitalized on that move due to a mean reversion play.
If XAG/USD records a daily close below October 22 low of $33.78 it would confirm a ‘bearish engulfing’ chart pattern and pave the way for a deeper pullback. In that outcome, Silver’s first support would be October 4 swing high at $32.95. A breach of the latter will reveal the May 20 peak at $32.51, followed by the October 17 low of $31.32.
For a bullish continuation, buyers must clear the $34.00 psychological figure, before challenging the YTD high at $34.86.
XAG/USD Price Chart – Daily
Silver FAQs
Silver is a precious metal highly traded among investors. It has been historically used as a store of value and a medium of exchange. Although less popular than Gold, traders may turn to Silver to diversify their investment portfolio, for its intrinsic value or as a potential hedge during high-inflation periods. Investors can buy physical Silver, in coins or in bars, or trade it through vehicles such as Exchange Traded Funds, which track its price on international markets.
Silver prices can move due to a wide range of factors. Geopolitical instability or fears of a deep recession can make Silver price escalate due to its safe-haven status, although to a lesser extent than Gold's. As a yieldless asset, Silver tends to rise with lower interest rates. Its moves also depend on how the US Dollar (USD) behaves as the asset is priced in dollars (XAG/USD). A strong Dollar tends to keep the price of Silver at bay, whereas a weaker Dollar is likely to propel prices up. Other factors such as investment demand, mining supply – Silver is much more abundant than Gold – and recycling rates can also affect prices.
Silver is widely used in industry, particularly in sectors such as electronics or solar energy, as it has one of the highest electric conductivity of all metals – more than Copper and Gold. A surge in demand can increase prices, while a decline tends to lower them. Dynamics in the US, Chinese and Indian economies can also contribute to price swings: for the US and particularly China, their big industrial sectors use Silver in various processes; in India, consumers’ demand for the precious metal for jewellery also plays a key role in setting prices.
Silver prices tend to follow Gold's moves. When Gold prices rise, Silver typically follows suit, as their status as safe-haven assets is similar. The Gold/Silver ratio, which shows the number of ounces of Silver needed to equal the value of one ounce of Gold, may help to determine the relative valuation between both metals. Some investors may consider a high ratio as an indicator that Silver is undervalued, or Gold is overvalued. On the contrary, a low ratio might suggest that Gold is undervalued relative to Silver.
Author

Christian Borjon Valencia
FXStreet
Markets analyst, news editor, and trading instructor with over 14 years of experience across FX, commodities, US equity indices, and global macro markets.


