Silver Price Forecast: XAG/USD rises above $69.00, but stays constrained below 100-day SMA
- Silver price advances to around $69.15 in Thursday’s Asian session.
- The white metal keeps a bearish vibe under the key 100-day SMA, RSI holding below the midline.
- The first upside barrier emerges at $70.00; the initial support level is seen at $66.81.
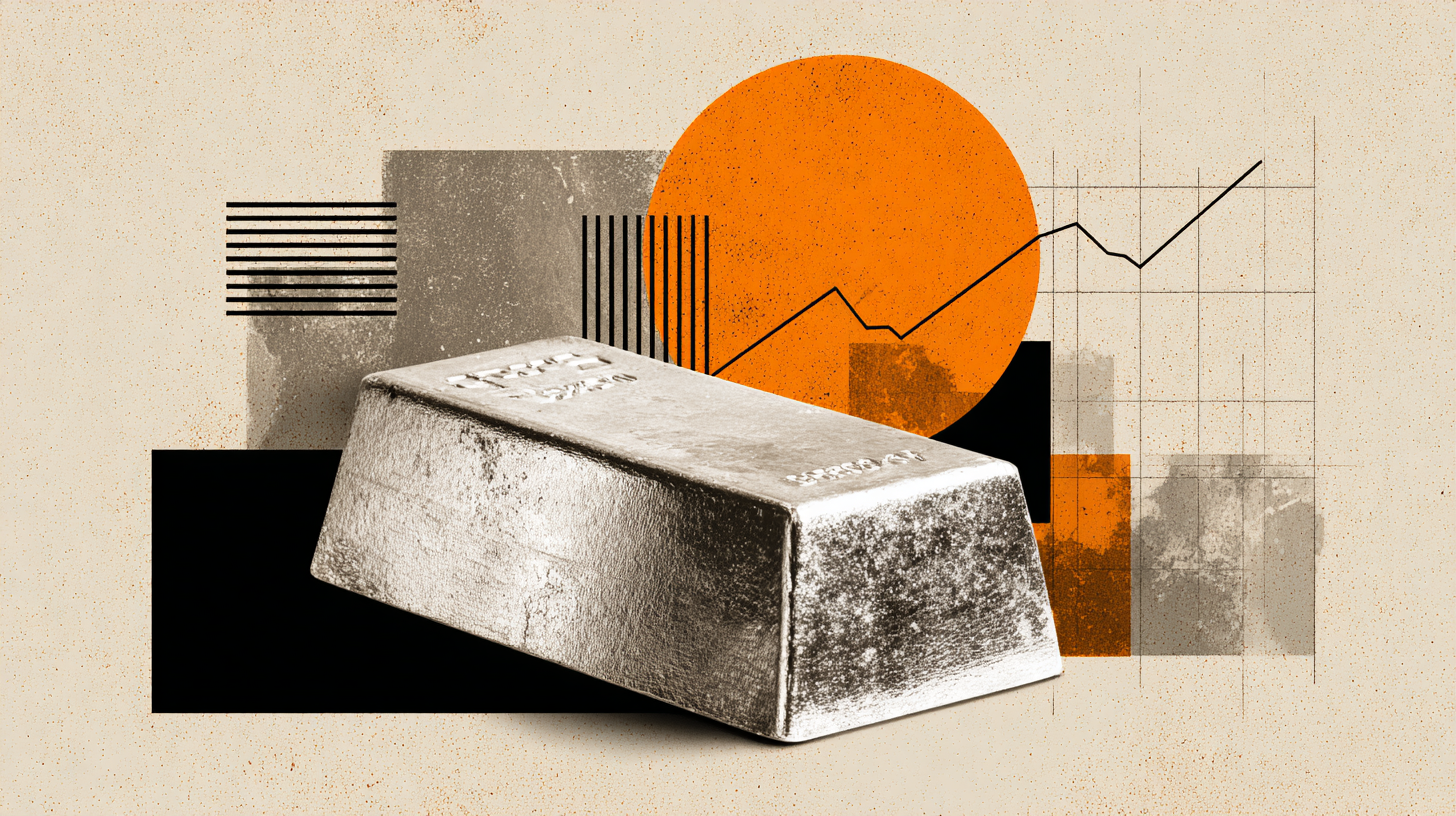
Silver price rises to near $69.15 during the Asian trading hours on Thursday. The white metal attracts some buyers following positive developments surrounding the US-Iran peace deal.
US President Donald Trump and Iranian President Masoud Pezeshkian both digitally signed the memorandum of understanding in English and Farsi aimed at ending the war with Iran. Pakistan’s Prime Minister Shehbaz Sharif said that the US-Iran agreement is taking “immediate effect” after being signed by both sides. This development has lowered crude oil prices, easing energy-driven inflation concerns and boosting demand for precious metals.
The US Federal Reserve (Fed) decided to leave the interest rates unchanged at its June meeting on Wednesday, while signaling the possibility of higher rates later this year. This, in turn, might cap the upside for silver, a non-yielding asset. It’s worth noting that Silver is often used as a hedge against inflation but does not yield interest, making it less attractive when interest rates are high.
Technical Analysis:
In the daily chart, XAG/USD stays capped beneath a dense confluence of resistance, with spot below the Bollinger middle band and well under the 100-day simple moving average (SMA), keeping the near-term bias tilted lower. The Relative Strength Index (RSI) hovers around 45, hinting at subdued bullish momentum after the recent pullback rather than an oversold condition, which suggests rallies are more likely to face selling pressure while price holds under these overhead levels.
On the topside, initial resistance is placed at the $70.00 psychological level. The next hurdle is seen at the Bollinger SMA around $71.45, ahead of the 100-day SMA at about $77.62, with the Bollinger upper band near $79.78 acting as a wider cap if buyers attempt a deeper recovery.
On the downside, the first support level is located at June 17 low of $66.81. The next contention level emerges at the Bollinger lower band near $63.15, where a break would open the door to further weakness, while holding above this floor would instead favor continued range trading beneath the clustered daily resistance band.
(The technical analysis of this story was written with the help of an AI tool.)
Silver FAQs
Silver is a precious metal highly traded among investors. It has been historically used as a store of value and a medium of exchange. Although less popular than Gold, traders may turn to Silver to diversify their investment portfolio, for its intrinsic value or as a potential hedge during high-inflation periods. Investors can buy physical Silver, in coins or in bars, or trade it through vehicles such as Exchange Traded Funds, which track its price on international markets.
Silver prices can move due to a wide range of factors. Geopolitical instability or fears of a deep recession can make Silver price escalate due to its safe-haven status, although to a lesser extent than Gold's. As a yieldless asset, Silver tends to rise with lower interest rates. Its moves also depend on how the US Dollar (USD) behaves as the asset is priced in dollars (XAG/USD). A strong Dollar tends to keep the price of Silver at bay, whereas a weaker Dollar is likely to propel prices up. Other factors such as investment demand, mining supply – Silver is much more abundant than Gold – and recycling rates can also affect prices.
Silver is widely used in industry, particularly in sectors such as electronics or solar energy, as it has one of the highest electric conductivity of all metals – more than Copper and Gold. A surge in demand can increase prices, while a decline tends to lower them. Dynamics in the US, Chinese and Indian economies can also contribute to price swings: for the US and particularly China, their big industrial sectors use Silver in various processes; in India, consumers’ demand for the precious metal for jewellery also plays a key role in setting prices.
Silver prices tend to follow Gold's moves. When Gold prices rise, Silver typically follows suit, as their status as safe-haven assets is similar. The Gold/Silver ratio, which shows the number of ounces of Silver needed to equal the value of one ounce of Gold, may help to determine the relative valuation between both metals. Some investors may consider a high ratio as an indicator that Silver is undervalued, or Gold is overvalued. On the contrary, a low ratio might suggest that Gold is undervalued relative to Silver.
Author

Lallalit Srijandorn
FXStreet
Lallalit Srijandorn is a Parisian at heart. She has lived in France since 2019 and now becomes a digital entrepreneur based in Paris and Bangkok.