Silver Price Forecast: XAG/USD clings to 200-day SMA as Fed takes center stage
- Silver trades flat near $70 as traders await the Fed's monetary policy announcement.
- Technically, XAG/USD has reclaimed its 200-day SMA, which now acts as immediate support.
- Momentum indicators show signs that bearish pressure is beginning to fade, with the RSI recovering from near-oversold territory.

Silver (XAG/USD) trades virtually unchanged on Tuesday around $70.00 after reclaiming its 200-day Simple Moving Average (SMA), as traders await the Federal Reserve's (Fed) monetary policy announcement before placing large directional bets.
The white metal is struggling to capitalize on the weaker US Dollar (USD) and lower Oil prices, which have come under pressure after the United States and Iran reached a framework agreement over the weekend.
Since the war began, Silver has traded more like an interest rate-sensitive asset than a traditional safe haven. The war-driven energy shock prompted traders to scale back expectations for Fed rate cuts and even price in the possibility of a rate hike later this year, which pushed XAG/USD down more than 30% from its pre-war levels.
However, following the announcement of the US-Iran agreement, buyers have gradually returned to the market as falling Oil prices ease inflation concerns.
Even so, traders appear reluctant to chase prices higher, with the Fed's monetary policy announcement likely to act as the next major catalyst in determining whether Silver can extend its recovery or surrender recent gains.
Technical analysis:
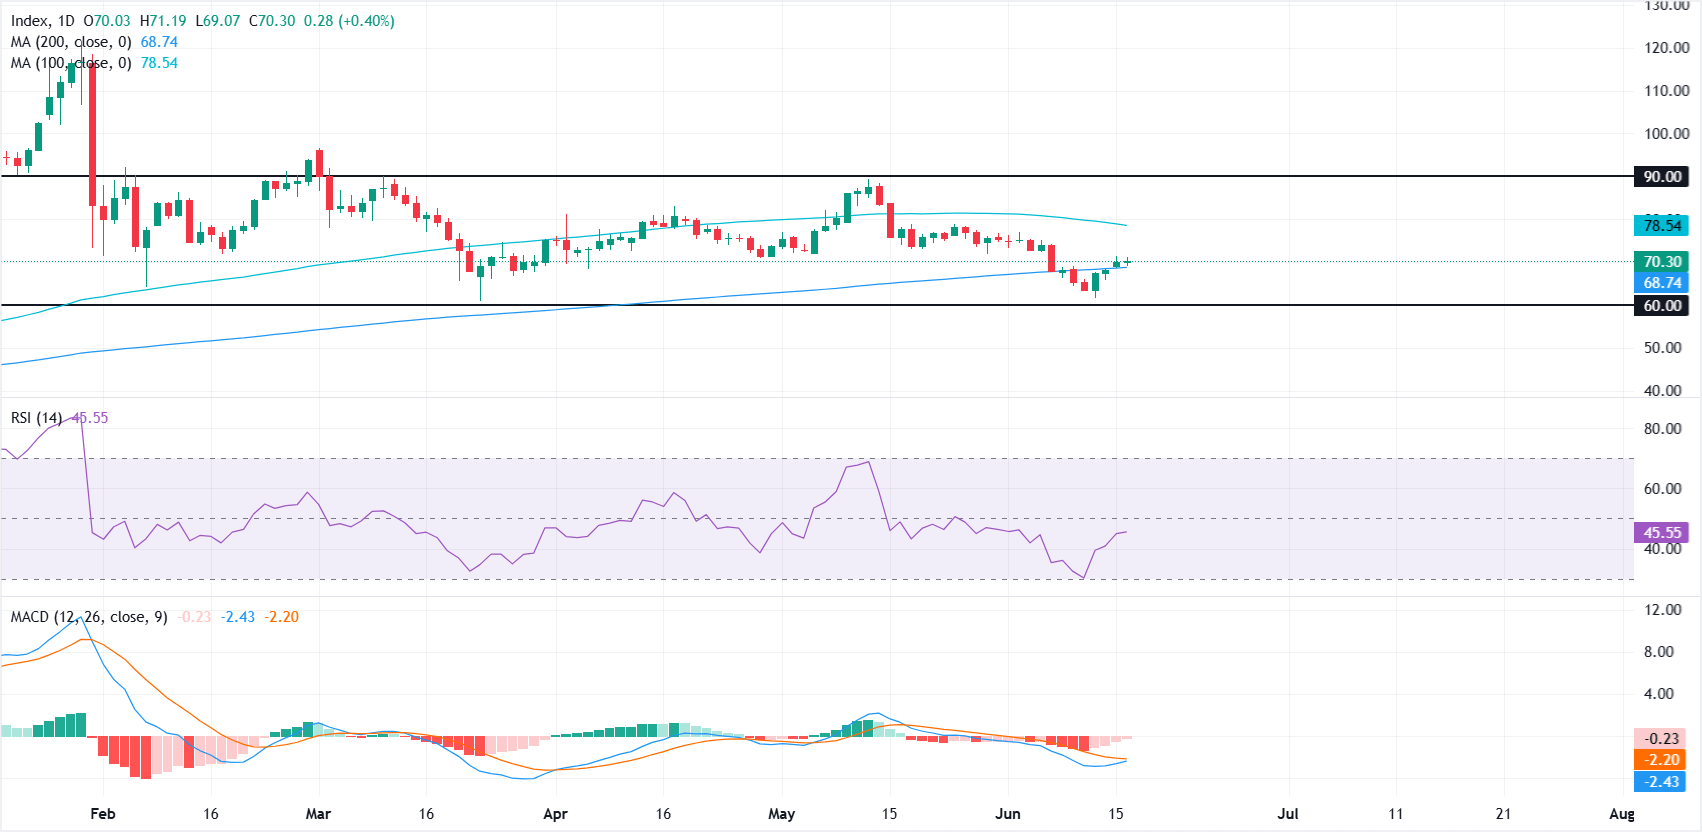
In the daily chart, XAG/USD holds a bearish near-term bias as price sits below the 100-day Simple Moving Average (SMA) at $78.54 while only marginally above the 200-day SMA at $68.74. This configuration suggests the broader trend has softened, with the 200-day SMA offering tentative medium-term support and the 100-day SMA now acting as an overhead cap.
Momentum indicators are showing early signs of stabilization. The Relative Strength Index (RSI) has recovered to 45.49 from near-oversold levels, suggesting selling pressure is easing. Meanwhile, the Moving Average Convergence Divergence (MACD) remains in negative territory, but the fading red histogram indicates bearish momentum is beginning to weaken.
On the downside, if the 200-day SMA fails to provide support, a sustained break below it could expose the next major support zone near $60.00. On the topside, recovery attempts are likely to face initial resistance at the 100-day SMA around $78.54. A daily close above that level would ease the bearish bias and open the door for a move toward the next resistance area near $90.00.
(The technical analysis of this story was written with the help of an AI tool.)
Silver FAQs
Silver is a precious metal highly traded among investors. It has been historically used as a store of value and a medium of exchange. Although less popular than Gold, traders may turn to Silver to diversify their investment portfolio, for its intrinsic value or as a potential hedge during high-inflation periods. Investors can buy physical Silver, in coins or in bars, or trade it through vehicles such as Exchange Traded Funds, which track its price on international markets.
Silver prices can move due to a wide range of factors. Geopolitical instability or fears of a deep recession can make Silver price escalate due to its safe-haven status, although to a lesser extent than Gold's. As a yieldless asset, Silver tends to rise with lower interest rates. Its moves also depend on how the US Dollar (USD) behaves as the asset is priced in dollars (XAG/USD). A strong Dollar tends to keep the price of Silver at bay, whereas a weaker Dollar is likely to propel prices up. Other factors such as investment demand, mining supply – Silver is much more abundant than Gold – and recycling rates can also affect prices.
Silver is widely used in industry, particularly in sectors such as electronics or solar energy, as it has one of the highest electric conductivity of all metals – more than Copper and Gold. A surge in demand can increase prices, while a decline tends to lower them. Dynamics in the US, Chinese and Indian economies can also contribute to price swings: for the US and particularly China, their big industrial sectors use Silver in various processes; in India, consumers’ demand for the precious metal for jewellery also plays a key role in setting prices.
Silver prices tend to follow Gold's moves. When Gold prices rise, Silver typically follows suit, as their status as safe-haven assets is similar. The Gold/Silver ratio, which shows the number of ounces of Silver needed to equal the value of one ounce of Gold, may help to determine the relative valuation between both metals. Some investors may consider a high ratio as an indicator that Silver is undervalued, or Gold is overvalued. On the contrary, a low ratio might suggest that Gold is undervalued relative to Silver.
Author

Vishal Chaturvedi
FXStreet
I am a macro-focused research analyst with over four years of experience covering forex and commodities market. I enjoy breaking down complex economic trends and turning them into clear, actionable insights that help traders stay ahead of the curve.


