Silver Price Forecast: XAG/USD attempts to reclaim $60 as bearish trend persists
- Silver rebounds as the US Dollar gives back part of its intraday gains despite upbeat US data.
- XAG/USD challenges the $60 support-turned-resistance level after recent stabilization.
- The broader technical picture remains bearish, limiting the scope for a sustained recovery.
Silver (XAG/USD) edges higher on Tuesday as the US Dollar (USD) trims part of its intraday gains despite upbeat US economic data. At the time of writing, XAG/USD trades around $59.70, up nearly 2.5% on the day.
US JOLTS Job Openings rose to 7.594 million in May from April's revised 7.585 million, beating market expectations of 7.3 million. Meanwhile, the Conference Board's Consumer Confidence Index climbed to 91.2 in June from 90.6 in May.
The US Dollar Index (DXY), which tracks the Greenback's value against a basket of six major currencies, is trading around 101.10 after hitting an intraday high of 101.43.
However, the DXY remains on track for a second consecutive monthly gain, leaving Silver down nearly 20% this month as hawkish Federal Reserve (Fed) expectations keep the Greenback supported and weigh on the non-yielding metal.
The technical outlook also suggests bears remain in control, making a meaningful recovery unlikely in the near term.
Technical Analysis:
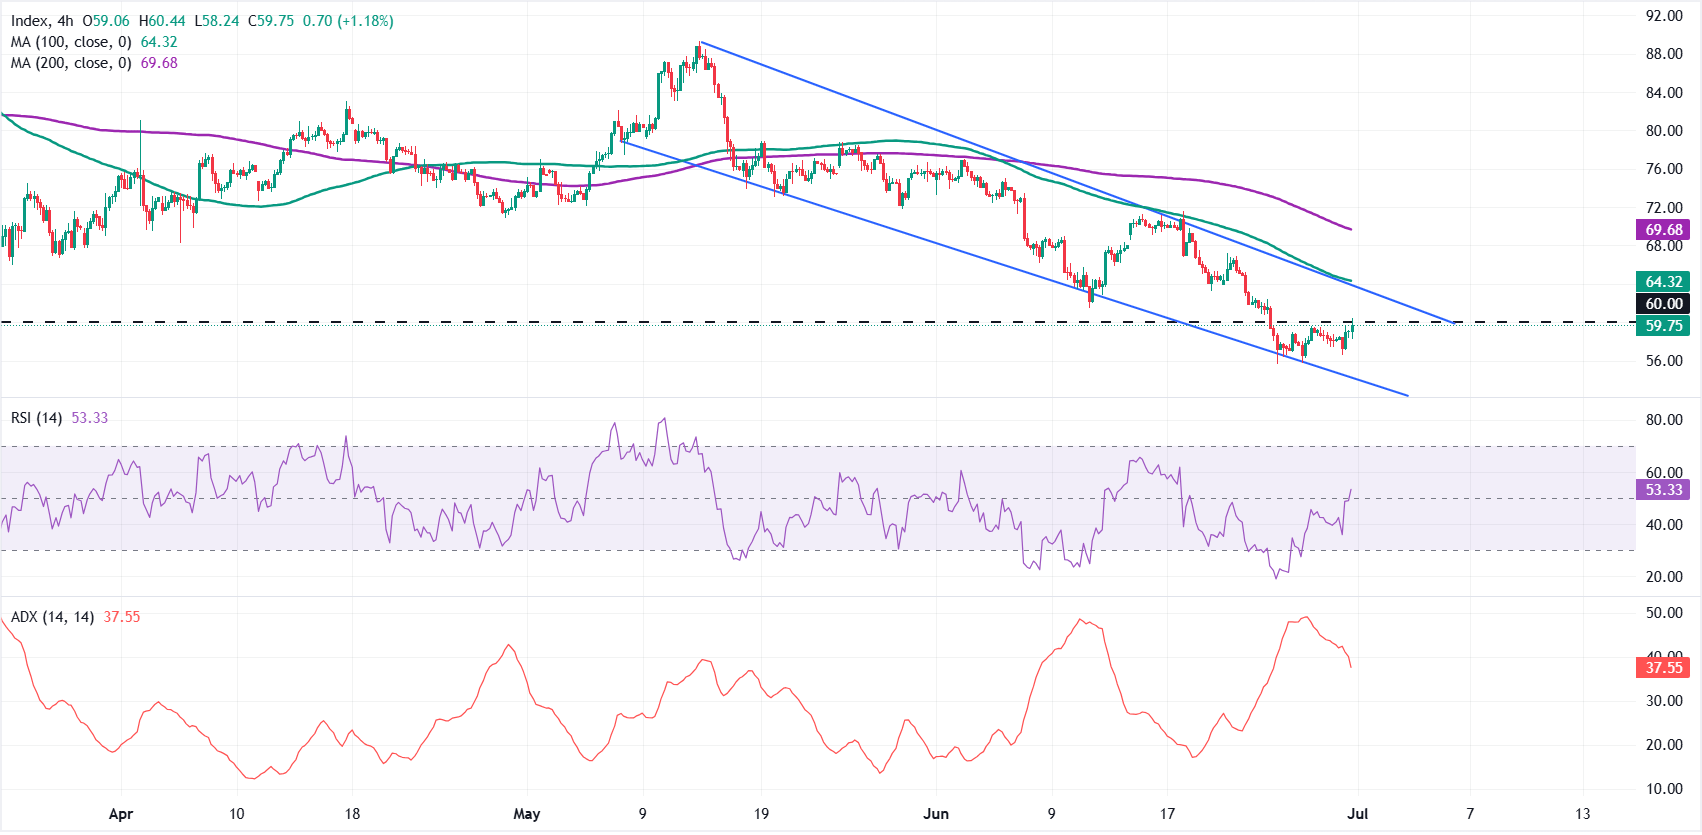
On the 4-hour chart, XAG/USD keeps a bearish near-term bias as price remains capped beneath the 100-period Simple Moving Average (SMA) at $64.32 and the 200-period SMA at $69.68.
The metal is also trading under a downward resistance trend line, with its break point at $63, while the horizontal barrier at $60 is being challenged but not yet reclaimed; momentum has improved with the Relative Strength Index (RSI) rising toward 54, and the Average Directional Index (ADX) easing toward 38, suggesting a consolidative phase within a broader downside structure.
On the topside, immediate resistance is located at the horizontal level of $60, followed by the trend-line break price at $63, before the 100-period SMA at $64.32 and the more distant 200-period SMA at $69.68 reinforce a dense supply zone. On the downside, the next notable structural support emerges near $50.00, and as long as XAG/USD trades beneath the clustered moving averages and trend resistance, rallies toward the $60-63 area are likely to struggle.
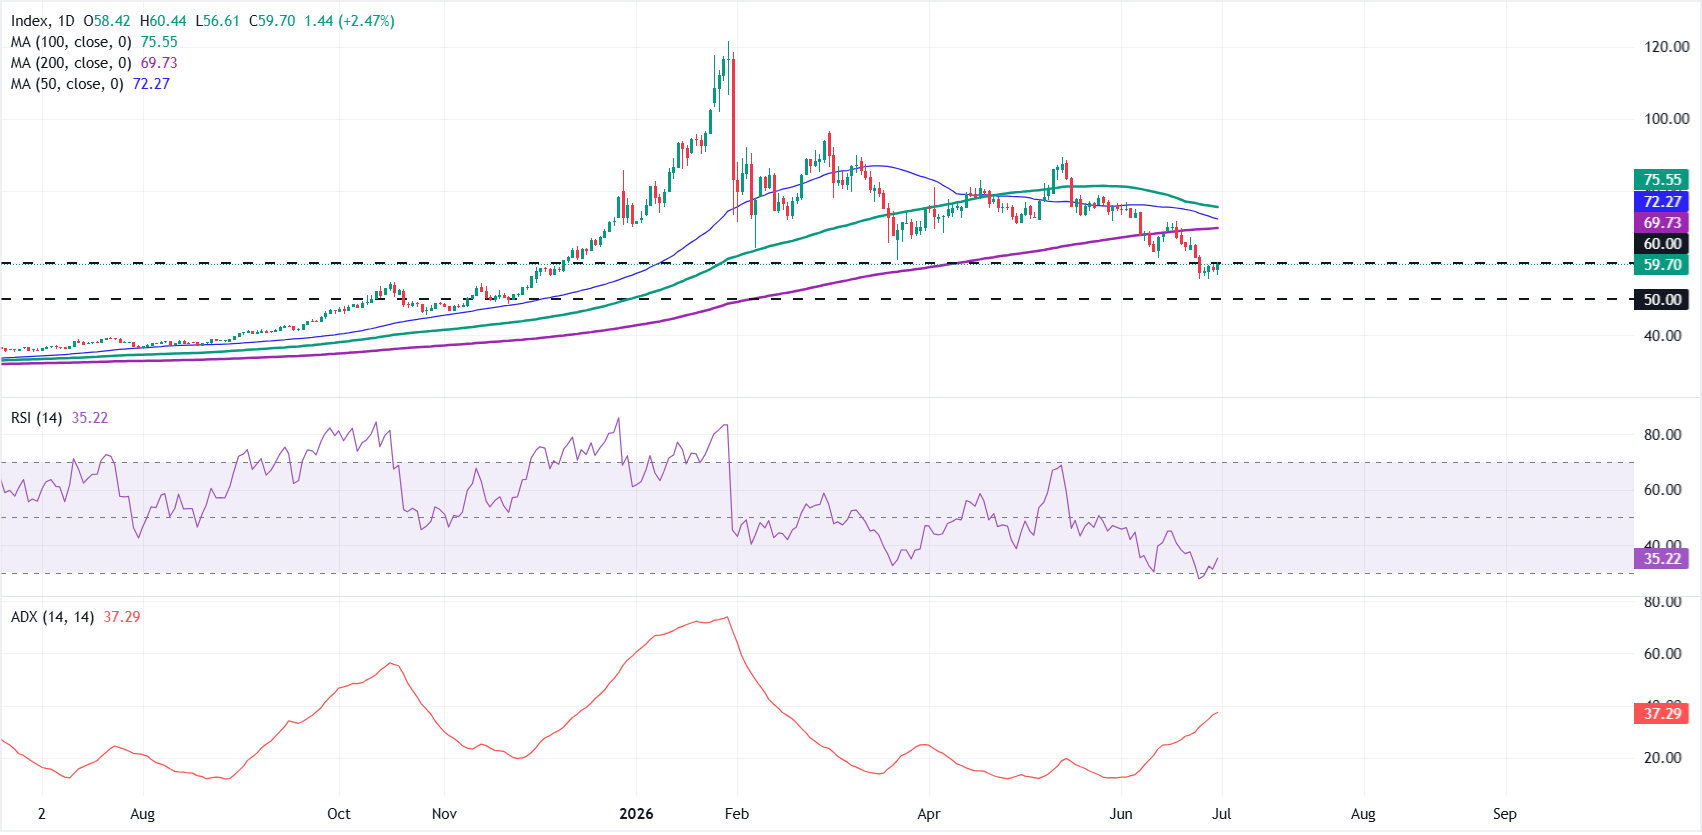
On the daily chart, XAG/USD remains under bearish pressure, with the price trading well below its 50-day, 100-day, and 200-day SMAs.
The RSI has recovered modestly from oversold territory but remains weak at around 35, suggesting bearish momentum is easing without signaling a trend reversal. Meanwhile, the Average Directional Index (ADX) near 37 points to a strong underlying trend, indicating sellers continue to hold the upper hand despite the recent stabilization.
On the topside, immediate resistance sits at the horizontal pivot around $60.00, which guards the path toward the 200-day SMA at $69.73 and then the 50-day SMA at $72.28, with the 100-day SMA at $75.55 marking a deeper corrective barrier if buyers gain traction.
(The technical analysis of this story was written with the help of an AI tool.)
Silver FAQs
Silver is a precious metal highly traded among investors. It has been historically used as a store of value and a medium of exchange. Although less popular than Gold, traders may turn to Silver to diversify their investment portfolio, for its intrinsic value or as a potential hedge during high-inflation periods. Investors can buy physical Silver, in coins or in bars, or trade it through vehicles such as Exchange Traded Funds, which track its price on international markets.
Silver prices can move due to a wide range of factors. Geopolitical instability or fears of a deep recession can make Silver price escalate due to its safe-haven status, although to a lesser extent than Gold's. As a yieldless asset, Silver tends to rise with lower interest rates. Its moves also depend on how the US Dollar (USD) behaves as the asset is priced in dollars (XAG/USD). A strong Dollar tends to keep the price of Silver at bay, whereas a weaker Dollar is likely to propel prices up. Other factors such as investment demand, mining supply – Silver is much more abundant than Gold – and recycling rates can also affect prices.
Silver is widely used in industry, particularly in sectors such as electronics or solar energy, as it has one of the highest electric conductivity of all metals – more than Copper and Gold. A surge in demand can increase prices, while a decline tends to lower them. Dynamics in the US, Chinese and Indian economies can also contribute to price swings: for the US and particularly China, their big industrial sectors use Silver in various processes; in India, consumers’ demand for the precious metal for jewellery also plays a key role in setting prices.
Silver prices tend to follow Gold's moves. When Gold prices rise, Silver typically follows suit, as their status as safe-haven assets is similar. The Gold/Silver ratio, which shows the number of ounces of Silver needed to equal the value of one ounce of Gold, may help to determine the relative valuation between both metals. Some investors may consider a high ratio as an indicator that Silver is undervalued, or Gold is overvalued. On the contrary, a low ratio might suggest that Gold is undervalued relative to Silver.
Author

Vishal Chaturvedi
FXStreet
I am a macro-focused research analyst with over four years of experience covering forex and commodities market. I enjoy breaking down complex economic trends and turning them into clear, actionable insights that help traders stay ahead of the curve.


