Silver Price Analysis: XAG/USD’s path of least resistance appears to the downside – Confluence Detector

Silver price is once again witnessing two-way movements so far this Thursday, although remains capped below the $28 mark. The upside attempts in the white metals appear limited, thanks to the revival of the Fed’s tapering expectations and China’s crackdown to stabilize the commodities market. Silver remains pressured by a sell-off in the industrial metals amid China's price curb threat. However, the retreat in the US dollar across the board helps cushion the downside in silver.
How is silver price positioned on the technical charts?
Silver Price: Key levels to watch
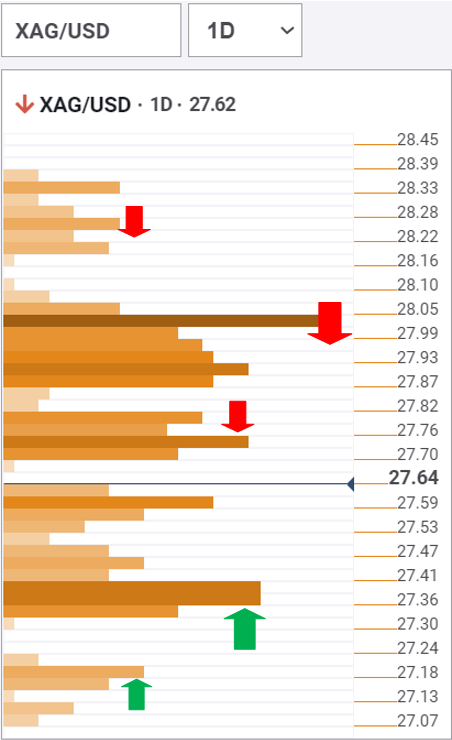
The Technical Confluences Detector shows that silver price has bounced off critical support around $27.40, where the previous day low, Bollinger Band four-hour Lower and Fibonacci 61.8% one-week converge.
If the bears manage to crack this support, the next downside target is envisioned at $27.15, the Fibonacci 38.2% one-week. That level appears to be the line in the sand for the optimists.
On the flip side, silver needs a sustained break above the $27.75 supply zone to revive the recovery momentum.
That area is the confluence of the SMA5 one-day, SMA5 four-hour and Fibonacci 38.2% one-day.
Further up, a dense cluster of resistance levels is stacked up between $27.90-$28.10 price band, which is the intersection of the pivot point one-month R2, pivot point one-week R1 and Fibonacci 61.8% one-day.
Recapturing the latter is critical to take on the previous day high of $28.24.
Here is how it looks on the tool
About Technical Confluences Detector
The TCD (Technical Confluences Detector) is a tool to locate and point out those price levels where there is a congestion of indicators, moving averages, Fibonacci levels, Pivot Points, etc. If you are a short-term trader, you will find entry points for counter-trend strategies and hunt a few points at a time. If you are a medium-to-long-term trader, this tool will allow you to know in advance the price levels where a medium-to-long-term trend may stop and rest, where to unwind positions, or where to increase your position size.
Author

Dhwani Mehta
FXStreet
Residing in Mumbai (India), Dhwani is a Senior Analyst and Manager of the Asian session at FXStreet. She has over 10 years of experience in analyzing and covering the global financial markets, with specialization in Forex and commodities markets.
















