|

Silver Price Analysis: XAG/USD struggles near multi-week low, seems vulnerable to slide further

  • Silver remains under some selling pressure for the fourth successive day on Thursday.
  • The technical setup favours bearish traders and supports prospects for deeper losses.
  • A sustained strength beyond $23.60-70 barrier is needed to negate the negative bias.

Silver (XAG/USD) attracts fresh sellers following an uptick to the $22.65 region and drifts into negative territory for the fourth successive day on Thursday. The white metal extends its intraday descent through the first half of the European session and drops to the $22.35 area in the last hour, back closer to over a three-week low touched on Wednesday.

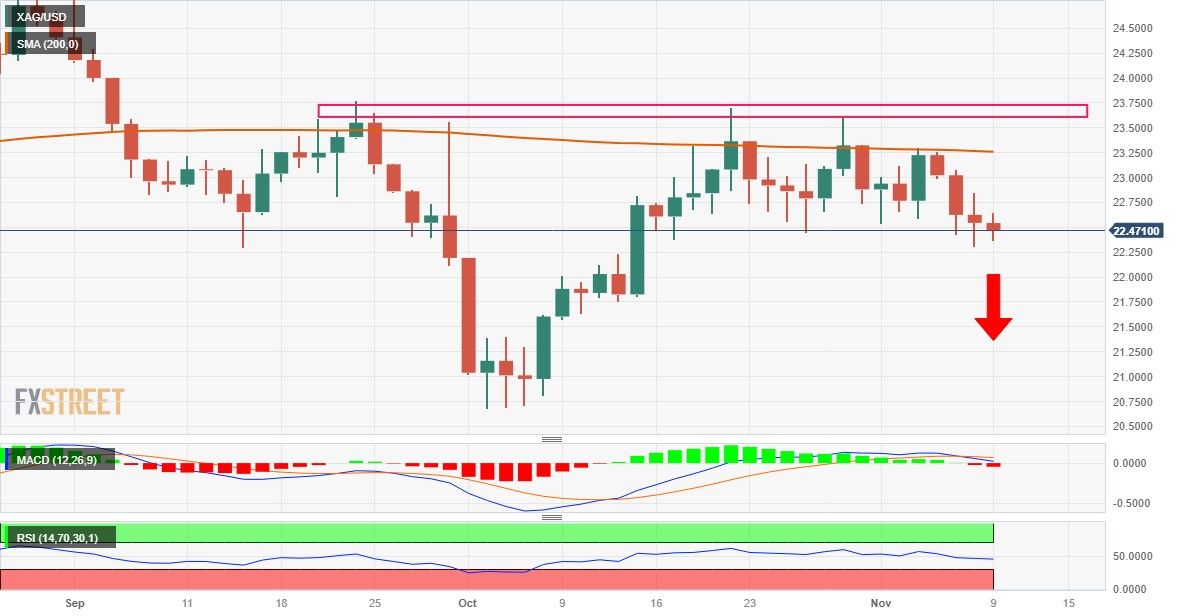
From a technical perspective, nothing seems to have changed for the XAG/USD and the near-term bias remains tilted firmly in favour of bearish traders. Against the backdrop of the recent repeated failures to find acceptance above the very important 200-day Simple Moving Average (SMA) and the overnight rejection near the $22.85-$22.80 horizontal support breakpoint validates the negative outlook.

Moreover, oscillators on the daily chart have just started drifting in the negative territory and support prospects for an extension of the recent downfall from the $23.60-$23.70 supply zone, which constituted the formation of multiple tops on the daily chart. Some follow-through selling below Wednesday's swing low, around the $22.30 area, will reaffirm the bearish bias and drag the XAG/USD to the $22.00 mark.

The next relevant support near the $21.70 zone, below which the XAG/USD could extend the downward trajectory further towards the $21.35-$21.30 support en route to the $21.00 round figure. Bearish traders might eventually aim to challenge a multi-month low, around the $20.70-$20.65 area touched in October.

On the flip side, the $22.80-$22.85 region might continue to act as an immediate hurdle ahead of the $23.00 mark and the 200-day SMA, currently near the $23.25 region. This is followed by the $23.60-$23.70 supply zone, which if cleared decisively will shift the near-term bias in favour of bullish traders. The XAG/USD might then climb further beyond the $24.00 mark, towards the $24.20-$24.25 intermediate hurdle, before making a fresh attempt to conquer the $25.00 psychological mark.

Silver daily chart
fxsoriginal

Technical levels to watch

XAG/USD

Overview
Today last price22.41
Today Daily Change-0.13
Today Daily Change %-0.58
Today daily open22.54
 
Trends
Daily SMA2022.86
Daily SMA5022.77
Daily SMA10023.19
Daily SMA20023.27
 
Levels
Previous Daily High22.85
Previous Daily Low22.3
Previous Weekly High23.61
Previous Weekly Low22.54
Previous Monthly High23.7
Previous Monthly Low20.68
Daily Fibonacci 38.2%22.51
Daily Fibonacci 61.8%22.64
Daily Pivot Point S122.28
Daily Pivot Point S222.02
Daily Pivot Point S321.74
Daily Pivot Point R122.83
Daily Pivot Point R223.11
Daily Pivot Point R323.37

Author

Haresh Menghani

Haresh Menghani is a detail-oriented professional with 10+ years of extensive experience in analysing the global financial markets.


More from Haresh Menghani
Share:

Editor's Picks

AUD/USD rises to 0.6950 as USD slips on Fed's Warsh

AUD/USD regains traction and extends the bounce toward 0.6950 in the Asian session on Friday. Fed Chair Warsh's comments reinforce the selling pressure on the US Dollar, allowing the pair to stretch higher. Warsh said that he remains committed to delivering price stability without giving away anything on future interest rate path.

USD/JPY falls in symc with USD, gives up 158.00 after Warsh's speech

USD/JPY has come under fresh selling pressure and gives up 158.00 in the Asian session on Friday amid the emergence of fresh US Dollar selling. Fed Chair Warsh's non-committal commentary on the future tightening path, weighs on the US Dollar and the pair.

Gold looks vacillating above $4,150

Gold alternates gains with losses below the key $4,200 mark per troy ounce on Friday. The yellow metal’s irresolute price action comes in response to a modest pullback in the US Dollar and a tepid recovery in US Treasury yields across the board.

Bitcoin steadies at $82,000: The five forces crushing the Uptober rally

Crypto markets have remained under pressure so far in October, with Bitcoin (BTC) sliding below $80,000 earlier this week before recovering to around $82,000 on Friday, as macroeconomic headwinds and cooling demand weigh on the market.

The Fed just got a second hot inflation number. Here's what the diesel signal is really saying
The Federal Reserve (Fed) faces a renewed inflation challenge after two consecutive reports showed price pressure intensifying across the US economy. September's Consumer Price Index (CPI) confirmed accelerating consumer inflation, while the Producer Price Index (PPI) revealed an even sharper rise in business costs. Behind both reports lies a common factor: energy prices.
Everyone's dumping Gold after hot US inflation. Here's why $4,100 could be a floor, not a cliff
Gold (XAU/USD) is recovering from a sharp sell-off triggered by hotter-than-expected United States (US) inflation data released on Wednesday. The precious metal briefly plunged toward $4,073 as investors increased their bets on further Federal Reserve (Fed) interest rate hikes before recovering as US Treasury yields and the US Dollar (USD) reversed their initial gains.














