Silver Price Analysis: XAG/USD retreats from weekly highs, falls beneath $32.00
- Silver retreats over 1% from $32.64 as rising US Treasury yields undermine gains.
- Technical outlook suggests consolidation possible between $31.00 and $32.60, with resistance at $33.00.
- Downward pressure may test support levels at $31.10 and $31.00, near critical moving averages.

Silver's price retreats after hitting a weekly high of $32.64 and drops below the psychological figure of $32.00 after the release of mixed US jobs data. The jump in US Treasury bond yields and Greenback’s remaining bid were headwinds for the grey metal. Therefore, Silver (XAG/USD) trades at $31.82, with losses of over 1%.
XAG/USD Price Analysis: Technical outlook
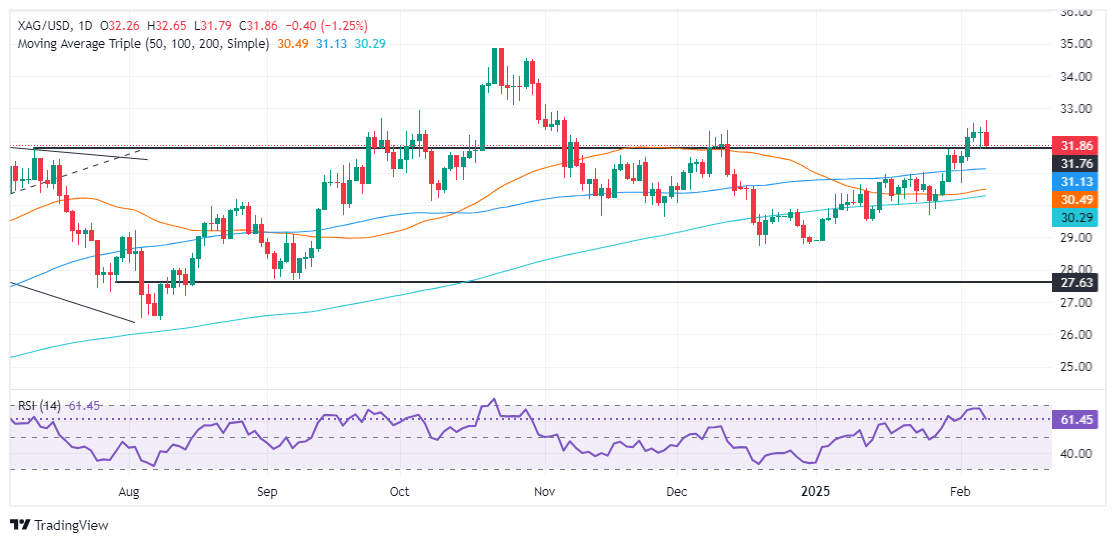
Despite reaching a two-month high, XAG/USD seems poised to consolidate around $31.00 - $32.60 unless buyers drive prices above $33.00 a troy ounce. Momentum has shifted bearish in the short-term, as portrayed by the Relative Strength Index (RSI), but buyers are in charge as the RSI remains above its neutral line.
XAG/USD needs to surpass $33.00 for an extension of the uptrend. A breach of that level could propel prices to test the October 29 swing high of $34.54, ahead of challenging last year’s peak at $34.86.
On the flip side, a further downside is seen below the 100-day SMA at $31.10, followed by the $31.00 figure. Once those levels are cleared, the next support would be the 50-day SMA at $30.47, followed by the 200-day SMA at $30.27
XAG/USD Price Chart – Daily
Silver FAQs
Silver is a precious metal highly traded among investors. It has been historically used as a store of value and a medium of exchange. Although less popular than Gold, traders may turn to Silver to diversify their investment portfolio, for its intrinsic value or as a potential hedge during high-inflation periods. Investors can buy physical Silver, in coins or in bars, or trade it through vehicles such as Exchange Traded Funds, which track its price on international markets.
Silver prices can move due to a wide range of factors. Geopolitical instability or fears of a deep recession can make Silver price escalate due to its safe-haven status, although to a lesser extent than Gold's. As a yieldless asset, Silver tends to rise with lower interest rates. Its moves also depend on how the US Dollar (USD) behaves as the asset is priced in dollars (XAG/USD). A strong Dollar tends to keep the price of Silver at bay, whereas a weaker Dollar is likely to propel prices up. Other factors such as investment demand, mining supply – Silver is much more abundant than Gold – and recycling rates can also affect prices.
Silver is widely used in industry, particularly in sectors such as electronics or solar energy, as it has one of the highest electric conductivity of all metals – more than Copper and Gold. A surge in demand can increase prices, while a decline tends to lower them. Dynamics in the US, Chinese and Indian economies can also contribute to price swings: for the US and particularly China, their big industrial sectors use Silver in various processes; in India, consumers’ demand for the precious metal for jewellery also plays a key role in setting prices.
Silver prices tend to follow Gold's moves. When Gold prices rise, Silver typically follows suit, as their status as safe-haven assets is similar. The Gold/Silver ratio, which shows the number of ounces of Silver needed to equal the value of one ounce of Gold, may help to determine the relative valuation between both metals. Some investors may consider a high ratio as an indicator that Silver is undervalued, or Gold is overvalued. On the contrary, a low ratio might suggest that Gold is undervalued relative to Silver.
Author

Christian Borjon Valencia
FXStreet
Markets analyst, news editor, and trading instructor with over 14 years of experience across FX, commodities, US equity indices, and global macro markets.


