|

Silver Price Analysis: XAG/USD rally stalls at around 200-DMA, bears eye $22.00

  • XAG/USD trades at around $22.85, a modest gain of 0.29%.
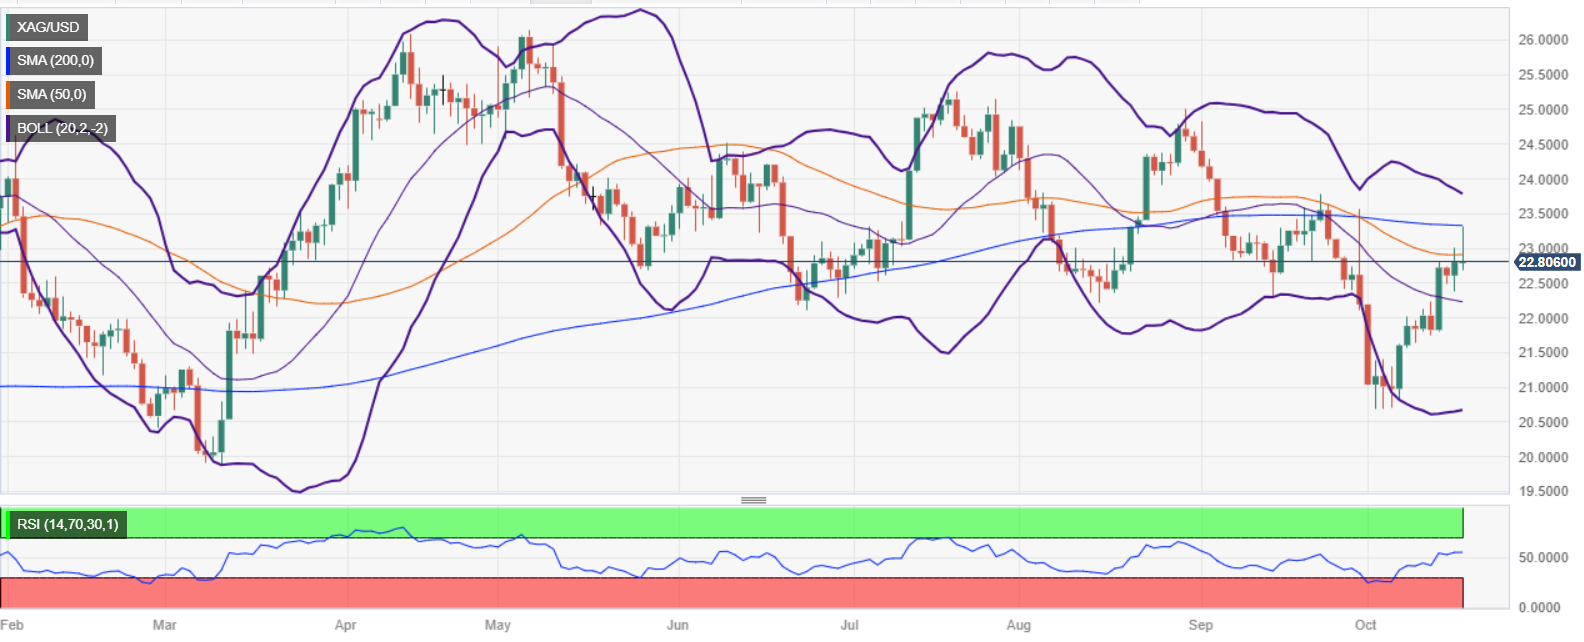
  • Supports are identified at the psychological level of $22.50, the 50-DMA at $22.85, and the 20-DMA at $22.21.
  • Immediate resistance lies at the 200-DMA at $23.31, with a key hurdle at the recent cycle high of $23.76.

Silver price (XAG/USD) clings to gains although US Treasury bond yields continued to rise. However, the white-metal, failed to reclaim the 200-day moving average (DMA), leaving Silver exposed to selling pressure, but at the time of writing, exchanges hands at $22.85, gaining 0.29%.

The daily chart portrays XAG/USD as neutral-downward biased, as the market structure registers lower highs and lower lows. Even though Silver has rallied from around October lows of $20.65, the ongoing rally is an impulse, which needs to clear the latest cycle high of $23.76. to pave the way for a bullish resumption.

Consequently, as XAG/USD’s downtrend remains in place, the current uptrend offers sellers a better entry price. Silver’s first support would be the psychological $22.50 figure after the white metal dropped below the 50=DMA at $22.85. Once those two areas are cleared, the next support would emerge at the 20-DMA at $22.21, followed by the $22.00 mark. Conversely, if XAG/USD climbs past the $23.00 figure, a challenge on the 200-DMA at $23.31 is on the cards.

XAG/USD Price Action – Daily chart
XAG/USD Technical Levels

XAG/USD

Overview
Today last price22.86
Today Daily Change0.06
Today Daily Change %0.26
Today daily open22.8
 
Trends
Daily SMA2022.25
Daily SMA5022.91
Daily SMA10023.31
Daily SMA20023.33
 
Levels
Previous Daily High23.01
Previous Daily Low22.37
Previous Weekly High22.82
Previous Weekly Low21.57
Previous Monthly High24.82
Previous Monthly Low22.12
Daily Fibonacci 38.2%22.77
Daily Fibonacci 61.8%22.62
Daily Pivot Point S122.45
Daily Pivot Point S222.09
Daily Pivot Point S321.81
Daily Pivot Point R123.08
Daily Pivot Point R223.36
Daily Pivot Point R323.72

Author

Christian Borjon Valencia

Markets analyst, news editor, and trading instructor with over 14 years of experience across FX, commodities, US equity indices, and global macro markets.


More from Christian Borjon Valencia
Share:

Editor's Picks

GBP/USD: Daily gains remain capped by 1.3650

GBP/USD leaves behind Monday’s pessimism and advances marginally on Tuesday. Cable’s humble gains, however, appear to have met quite a decent resistance in the 1.3650 zone for now, in a context of a slight selling pressure hovering around the Greenback.

EUR/USD struggles to regain pace; gyrates around 1.1670

EUR/USD clinches humble gains around 1.1670 following Tuesday’s close on Wall Street. Indeed, marginal losses in the US Dollar encourages spot to set aside two dauly pullbacks in a row and maintain the 1.1700 barrier on the cross-hairs for now. Moving forward, US inflation tracked by the PCE and another revision of Q2 GDP data should keep investors entertained on Wednesday.

Gold: Buyers still hold the grip

Gold navigates the middle of its daily range near $4,650 per troy ounce on Tuesday. The lack of clear direction in the yellow metal comes on the back of the widespread cautious tone among market participants, a mildly offered stance in the US Dollar and a marked decline in US Treasury yields across the curve.

BNB Price Forecast: BNB rally stalls as Pasteur hardfork launches on BSC mainnet
BNB (BNB) shows subtle weakness, sliding below $700 on Tuesday. Last week's broader crypto rally propelled BNB to $725 from support around $600. The token native to Binance, the largest crypto exchange by trading volume, flaunts a bullish picture. However, momentum indicators signal that the uptrend may be overstretched, raising the odds of an extended correction.
Nvidia earnings: A quick look at expectations

The 2026 Q2 earnings season is nearly over for S&P 500 members, with the reporting cycle notably positive. But looming large this week is none other than AI-favorite NVIDIA (NVDA) , whose results will wrap up the reporting cycle for the Magnificent Seven group as well.

$20 billion offered, $2 billion taken: Why Treasury doubled its buyback cap

The US Treasury moved off its own calendar on Wednesday, and that is the part worth sitting with. At 12:32 GMT, the department said it would at least double the size of liquidity support buyback operations in the 10-year to 20-year and 20-year to 30-year sectors, lifting the maximum from $2 billion per operation to at least $4 billion, effective September 9 and running to November 4.















