|

Silver Price Analysis: XAG/USD holds to gains above @$25.00 as rising-wedge looms

  • Four days of steady upward momentum on the daily chart, with XAG/USD consolidating around the $24.50-$25.20 zone.
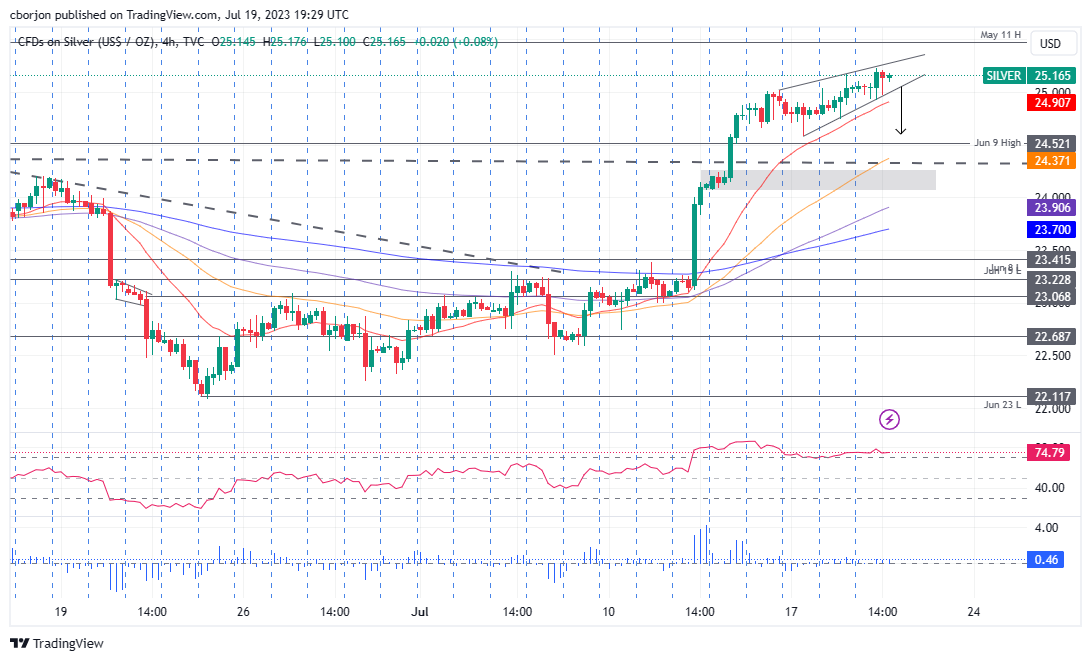
  • The 4-hour chart signals a potential pullback, forming a rising wedge with the 20-EMA offering possible support at around $24.95.
  • Resistance lies at the May 11 high of $25.47 and the May 10 high of $25.91. Should XAG/USD fall, support can be found at $25.00, $24.95 (20-EMA), and $24.52 (June 9 high).

Silver price achieves modest gains on Wednesday amid falling US Treasury bond yields despite overall US Dollar (USD) strength across the FX board. Soft US housing data, and yesterday’s mixed Retail Sales figures, boosted the USD. That said, the XAG/USD is trading at $25.14, above its opening price by 0.34%.

XAG/USD Price Analysis: Technical outlook

The XAG/USD daily chart portrays the white metal as upward biased, rising steadily during the last four days after the July 13 rally of almost 3%. Since then, the XAG/USD has remained at around the $24.50-$25.20 area, consolidating ahead of testing strong resistance at the May 11 daily high of $25.47, ahead of the XAG/USD’s reaching the year-to-date (YTD) high of $26.13.

From an intraday perspective, the XAG/USD 4-hour chart portrays the pair as upward biased but forming a rising wedge, which could pave the way for a pullback. Still, the presence of the 20-Exponential Moving Average (EMA) at around $24.95 tracks XAG/USD  price action and might cap Silver’s fall, once it breaks out.

The XAG/USD first support would be the $25.00 figure. Once cleared, the next support would be the 20-EMA at $24.95, followed by the June 9 daily high at $24.52. A breakout below that level would expose a strong support area at around $24.00/25.

Conversely, if XAG/USD rallies past the top of the rising wedge, the following supply area would be the May 11 daily high at $25.47, followed by the May 10 high at $25.91.

XAG/USD Price Action – 4-Hour chart
XAG/USD Daily chart

XAG/USD

Overview
Today last price25.17
Today Daily Change0.11
Today Daily Change %0.44
Today daily open25.06
 
Trends
Daily SMA2023.3
Daily SMA5023.56
Daily SMA10023.61
Daily SMA20022.82
 
Levels
Previous Daily High25.17
Previous Daily Low24.77
Previous Weekly High25.02
Previous Weekly Low22.75
Previous Monthly High24.53
Previous Monthly Low22.11
Daily Fibonacci 38.2%25.02
Daily Fibonacci 61.8%24.92
Daily Pivot Point S124.83
Daily Pivot Point S224.6
Daily Pivot Point S324.43
Daily Pivot Point R125.23
Daily Pivot Point R225.4
Daily Pivot Point R325.64

Author

Christian Borjon Valencia

Markets analyst, news editor, and trading instructor with over 14 years of experience across FX, commodities, US equity indices, and global macro markets.


More from Christian Borjon Valencia
Share:

Editor's Picks

AUD/USD drops to one-week low, below 0.6950 on weak Aussie jobs data

AUD/USD attracts some sellers in reaction to disappointing Australian jobs data, extending the previous day's retracement slide from the monthly high and hitting a fresh weekly low during Thursday’s Asian session. Meanwhile, declining US bond yields drag the US Dollar away from the April 2025 high, touched after Wednesday's hot US CPI, helping limit losses for the currency pair.

USD/JPY slides back below 158.00 as USD reverses post-CPI gains

USD/JPY extends the previous day's pullback from a three-week high, attracting follow-through selling and sliding below 158.00 during Thursday's Asian session. Traders remain on high alert amid speculation that authorities will step in to prop up the Japanese Yen. The US Dollar, meanwhile, reverses Wednesday's hot CPI-led gains to April 2025 highs as US bond yields retreat, further pressuring the currency pair.

Gold recovers to $4,150 as retreating US bond yields weigh on USD

Gold attracts strong buying during the Asian session on Thursday, snapping a three-day losing streak to a one-week low. Retreating US bond yields drag the US Dollar away from the April 2025 high, touched in reaction to Wednesday’s hot US CPI report, and boost the non-yielding bullion. That said, energy-driven inflation risks keep bets of a Fed rate hike firmly on the table, which should cap the precious metal.

Bitcoin falls on hot CPI: Why $80,000 support matters

Bitcoin's (BTC) most critical level to watch is near $80,000 as September's hot inflation reading pressures the crypto market, according to Glassnode. The top crypto declined within minutes of the September Consumer Price Index (CPI) release, which showed a 3.7% annual increase in headline inflation, above forecasts of 3.6%. Core inflation, which excludes food and energy prices, came in at 2.6%.

Stock futures just went red on the CPI. Here's what the bond market is pricing that equities haven't caught up to

Since late June, the bond market has been pricing in a Federal Reserve that keeps raising rates into 2027, and most US stocks have already been marked down for it. The S&P 500 hasn't, because a handful of AI-linked giants make up much of the index and their prices haven't followed the rest.

Has Bitcoin really escaped the macro forces it was built to fight?
Over 17 years ago, Satoshi Nakamoto designed Bitcoin (BTC) on the back of a global financial crisis as an alternative to the global monetary system outside the control of central banks, governments and traditional intermediaries. This raises a key question: has Bitcoin really become independent of the macroeconomic forces it was built to challenge?















