Silver Price Analysis: XAG/USD escalates to eight-day high surpasses $30.00
- Silver climbs to $30.66, an eight-day peak, surpassing the $30.00 resistance.
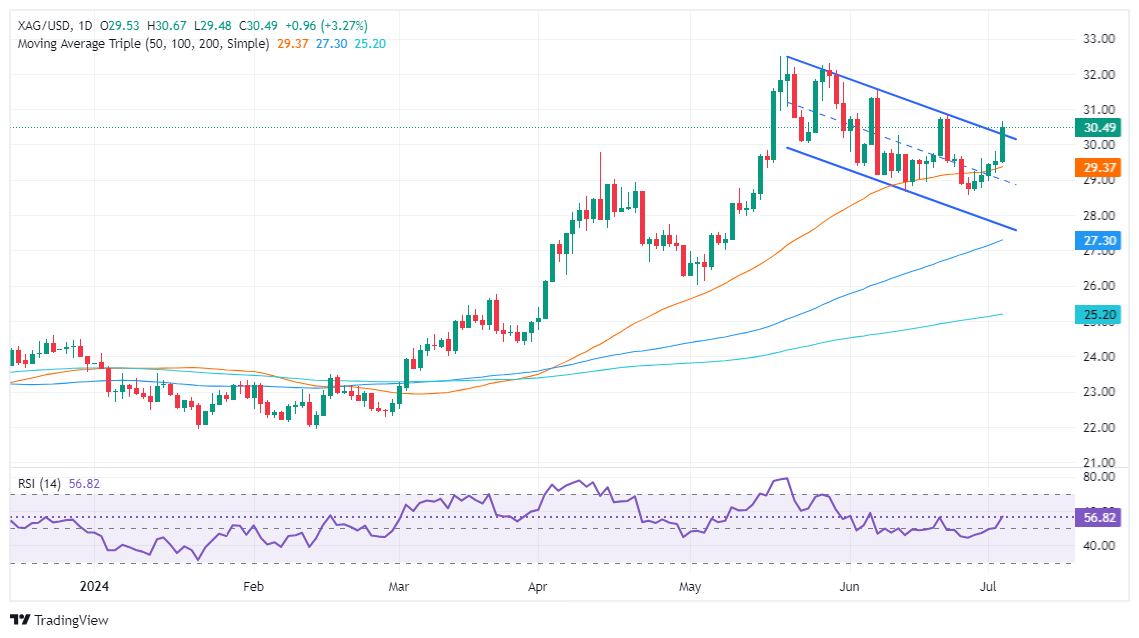
- Technicals indicate a strong upward trend, with XAG/USD exiting a descending channel.
- Resistance levels: $30.84 (June 21 high), $32.51 (YTD high).
- Support points: $30.00, $29.48 (July 3 low), $29.00, $28.57 (June 26 low), $27.59 (April 15 low).

Silver price surged on Wednesday and, on its way north, cleared the key resistance trendline seen passing at around $30.00, which underpinned the grey metal to an eight-day high of $30.66. As the Asian session begins, the XAG/USD trades at $30.44, virtually unchanged.
XAG/USD Price Analysis: Technical outlook
Silver's upward trend is still in place, with the non-yielding metal clearing the top of a descending channel, which opens the door for further upside. Buyers remain hopeful that the 'double bottom' chart pattern will be confirmed as they eye the next possible upside target at $30.84, the June 21 cycle high. Once hurdle, up next would be the year-to-date (YTD) high of $32.51.
On the downside, if XAG/USD drops below $30.00, the next support level would be the July 3 low of $29.48, ahead of $29.00. Further losses are seen once Silver clears the June 26 low at $28.57. Falling below this level could lead to a decline towards the April 15 swing low of $27.59.
XAG/USD Price Action – Daily Chart
Silver FAQs
Silver is a precious metal highly traded among investors. It has been historically used as a store of value and a medium of exchange. Although less popular than Gold, traders may turn to Silver to diversify their investment portfolio, for its intrinsic value or as a potential hedge during high-inflation periods. Investors can buy physical Silver, in coins or in bars, or trade it through vehicles such as Exchange Traded Funds, which track its price on international markets.
Silver prices can move due to a wide range of factors. Geopolitical instability or fears of a deep recession can make Silver price escalate due to its safe-haven status, although to a lesser extent than Gold's. As a yieldless asset, Silver tends to rise with lower interest rates. Its moves also depend on how the US Dollar (USD) behaves as the asset is priced in dollars (XAG/USD). A strong Dollar tends to keep the price of Silver at bay, whereas a weaker Dollar is likely to propel prices up. Other factors such as investment demand, mining supply – Silver is much more abundant than Gold – and recycling rates can also affect prices.
Silver is widely used in industry, particularly in sectors such as electronics or solar energy, as it has one of the highest electric conductivity of all metals – more than Copper and Gold. A surge in demand can increase prices, while a decline tends to lower them. Dynamics in the US, Chinese and Indian economies can also contribute to price swings: for the US and particularly China, their big industrial sectors use Silver in various processes; in India, consumers’ demand for the precious metal for jewellery also plays a key role in setting prices.
Silver prices tend to follow Gold's moves. When Gold prices rise, Silver typically follows suit, as their status as safe-haven assets is similar. The Gold/Silver ratio, which shows the number of ounces of Silver needed to equal the value of one ounce of Gold, may help to determine the relative valuation between both metals. Some investors may consider a high ratio as an indicator that Silver is undervalued, or Gold is overvalued. On the contrary, a low ratio might suggest that Gold is undervalued relative to Silver.
Author

Christian Borjon Valencia
FXStreet
Markets analyst, news editor, and trading instructor with over 14 years of experience across FX, commodities, US equity indices, and global macro markets.


