Silver Price Analysis: Bullish harami forms, eyes on $80 breakout
- Silver forms bullish harami, signaling potential short-term upside continuation.
- RSI nears bullish flip despite lingering bearish momentum backdrop.
- Break above $78.88 exposes $80.00 and 100-day SMA.
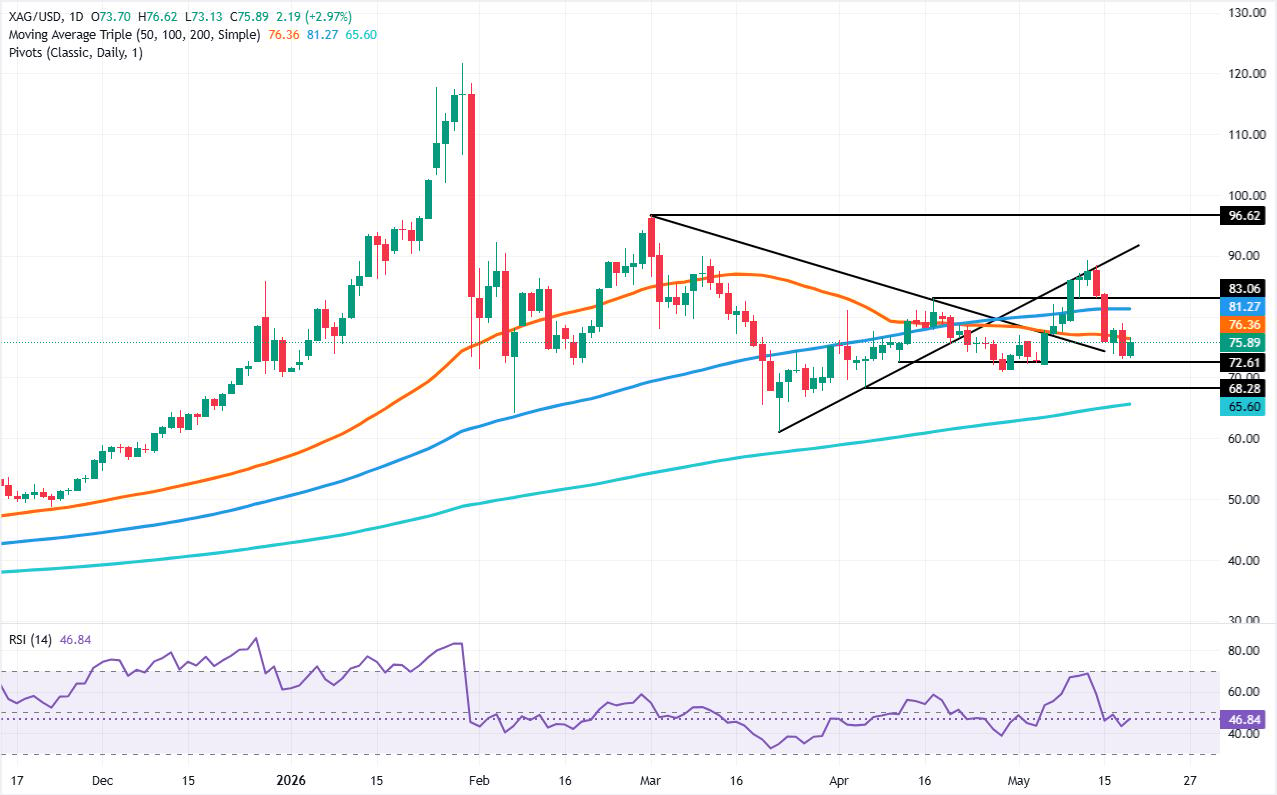
Silver price advances during the North American session as it forms a ‘bullish harami’ candle chart pattern, an indication that further upside is seen in the short term. At the time of writing, the XAG/USD trades at $75.85, up more than 3%.
XAG/USD Price Analysis: Technical outlook
From a market structure perspective, Silver is upwardly biased but is facing key resistance levels. Momentum remains bearish as depicted in the Relative Strength Index (RSI). Still worth noting, the RSI is about to turn bullish, opening the door for further upside.
The ‘bullish harami’ chart pattern or an ‘inside day’ needs confirmation. This means that XAG/USD must surpass the May 19 daily high of $78.88, which would pave the way for further gains. Above this area, the next resistance is the $80.00 mark, followed by the 100-day Simple Moving Average (SMA) at $81.05.
Downwards, if XAG/USD tumbles below the May 19 daily low of $73.09, expect a drop towards the April 29 daily low of $70.86, ahead of the $70.00 threshold.
XAG/USD Price Chart – Daily
Silver FAQs
Silver is a precious metal highly traded among investors. It has been historically used as a store of value and a medium of exchange. Although less popular than Gold, traders may turn to Silver to diversify their investment portfolio, for its intrinsic value or as a potential hedge during high-inflation periods. Investors can buy physical Silver, in coins or in bars, or trade it through vehicles such as Exchange Traded Funds, which track its price on international markets.
Silver prices can move due to a wide range of factors. Geopolitical instability or fears of a deep recession can make Silver price escalate due to its safe-haven status, although to a lesser extent than Gold's. As a yieldless asset, Silver tends to rise with lower interest rates. Its moves also depend on how the US Dollar (USD) behaves as the asset is priced in dollars (XAG/USD). A strong Dollar tends to keep the price of Silver at bay, whereas a weaker Dollar is likely to propel prices up. Other factors such as investment demand, mining supply – Silver is much more abundant than Gold – and recycling rates can also affect prices.
Silver is widely used in industry, particularly in sectors such as electronics or solar energy, as it has one of the highest electric conductivity of all metals – more than Copper and Gold. A surge in demand can increase prices, while a decline tends to lower them. Dynamics in the US, Chinese and Indian economies can also contribute to price swings: for the US and particularly China, their big industrial sectors use Silver in various processes; in India, consumers’ demand for the precious metal for jewellery also plays a key role in setting prices.
Silver prices tend to follow Gold's moves. When Gold prices rise, Silver typically follows suit, as their status as safe-haven assets is similar. The Gold/Silver ratio, which shows the number of ounces of Silver needed to equal the value of one ounce of Gold, may help to determine the relative valuation between both metals. Some investors may consider a high ratio as an indicator that Silver is undervalued, or Gold is overvalued. On the contrary, a low ratio might suggest that Gold is undervalued relative to Silver.
Author

Christian Borjon Valencia
FXStreet
Markets analyst, news editor, and trading instructor with over 14 years of experience across FX, commodities, US equity indices, and global macro markets.


