Semiconductor Index rally stays on course, but signs point to a sharp retracement

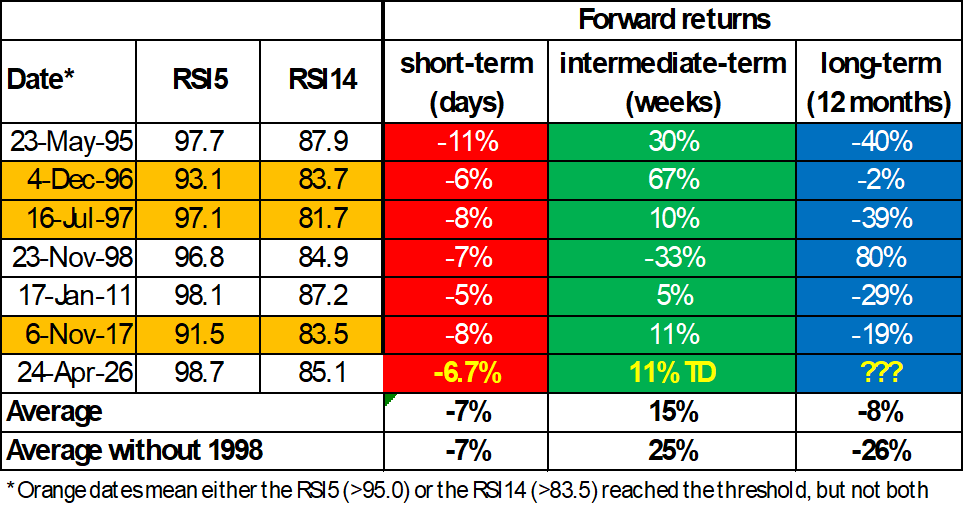
In our previous update on the semiconductor index (SOX), we showed that, based on historical analyses of the relative strength indicator (RSI) returns for the short-, intermediate-, and long-term, the average returns were -7%, +15-25%, and -8 to -26%, respectively. See Table 1 below.
Table 1: Forward returns when the daily RSI5 and 14 are above 95 and 83.5, respectively
Fast-forward to today, the index lost 6.7% at the April 28 low and has since risen ~11% from the April 26 high. So far, so good. The index is right on track. Moreover, in our previous update, we used our Elliott Wave Principle (EWP) count, see figure 1 below, to show that
“the index has likely completed a 3rd of a 3rd wave: green W-3 of red W-iii, and is now in green W-4, ideally $9700 +/- 200, before W-5 to $13,000+ can take hold. After that, a final, larger 4th and 5th wave (red W-iii and -iv) should commence before the move from the April 2025 low can be considered complete, allowing the index to enter a new bear market.”
Figure 1. Daily chart of the SOX with Elliott Wave Count
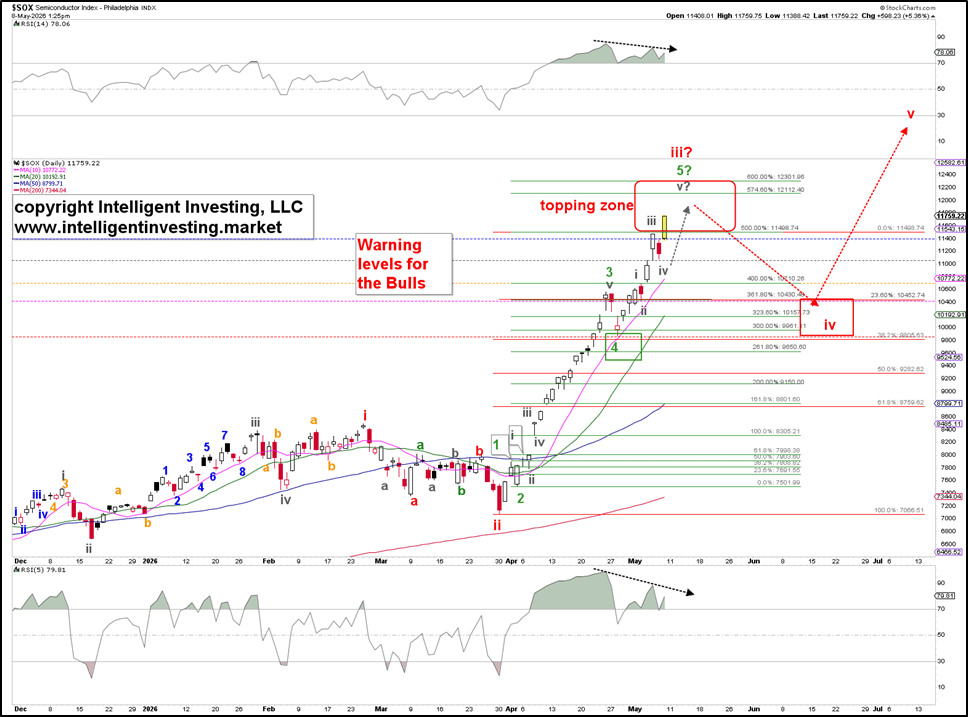
So far, so good. The EWP count is right on track with the index’s price action, as it bottomed out on April 28 at $9,865 and is now trading around $11,760.
One of the most common misconceptions about the Elliott Wave Principle (EWP) is that it offers rigid, precise market predictions. This is not the case. Financial markets are inherently stochastic and probabilistic. Rather than predicting the future, EWP provides a structured framework for understanding price action through recurring, fractal wave patterns driven by collective investor psychology — typically five-wave advances and three-wave corrections. These patterns follow specific rules and guidelines (such as Fibonacci relationships and wave alternation) and unfold across multiple time scales.
Analysts use the EWP to outline probable scenarios, which are refined as new data emerges — much like a weather forecast. Its real strength lies not in pinpoint accuracy but in providing a disciplined framework for assessing risk-reward, identifying high-probability setups, and maintaining awareness of the broader market context.
Like all technical tools, the EWP performs best when combined with other analyses (including historical studies, as presented here) and applied with experience and humility. Its main limitation remains real-time relabeling, e.g., due to wave extensions or complex subdivisions, which require strict adherence to rules, price levels, and continuous validation against the ongoing price action. By accepting these few limitations and embracing the reliability of a combined approach, we gain access to one of the best forecasts available.
Thus, the larger (red) W-iii is rapidly approaching its end, as its 5th of a 5th wave (gray W-v of green W-5) is underway. The ideal upside target is based on very extended Fibonacci levels: $12,110 – $12,300. Once reached, the odds of a retrace to about $10,000 increase significantly
Author

Dr. Arnout Ter Schure
Intelligent Investing, LLC
After having worked for over ten years within the field of energy and the environment, Dr.


