RTY short term trade setup – Buyers profit from blue box

The Russell 2000 (RTY) futures contract serves as a vital benchmark for the Russell 2000 Index, tracking the performance of 2,000 small-cap U.S. companies. As a primary indicator of market health and risk appetite within the small-cap sector, RTY is uniquely sensitive to domestic economic shifts. This sensitivity often translates into heightened volatility and distinct trading opportunities, establishing RTY as a preferred instrument for short-term traders seeking to capitalize on market movements.
The Russell 2000 has maintained a remarkably strong, all-time bullish trend and is currently outperforming other major U.S. indices. While the Dow, Nasdaq, and S&P 500 have traded sideways and struggled to reach new highs, the RTY continues to set new milestones. According to our weekly chart, the grand supercycle degree ((II)) concluded in March 2020. Wave I of ((II)) ended in November 2011 as an impulse structure, followed by a flat structural pullback that completed wave II in April 2025. From the April 2025 low, wave III began and officially established the 3rd cycle degree by breaching the wave I top in September 2025. After completing waves ((1)) and ((2)) of III in January and March 2026, respectively, the index surged upward. Consequently, we are identifying and capitalizing on dip-buying opportunities with every breakout.
How do we buy the dips? We wait for a zigzag, double zigzag and triple zigzag corrective structure. In the case of the recent RTY short term bullish setup, we traded the extreme of the double zigzag structure.
About the double zigzag structure
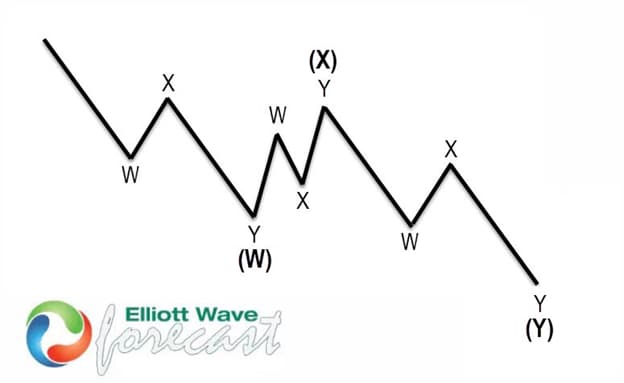
A double zigzag in Elliott Wave Theory is a corrective pattern labeled W-X-Y, made up of two zigzags connected by a smaller corrective wave. Each zigzag typically follows a 5-3-5 structure. Traders usually see a double zigzag when a single zigzag doesn’t correct price deeply enough, so the market extends the correction with another zigzag in the same direction. It often appears in strong trends as a sharper, more directional correction compared to flats or triangles. In simple terms, it’s a double three structure used to deepen a pullback before the main trend resumes.
RTY short-term setup – 8th July 2026 update
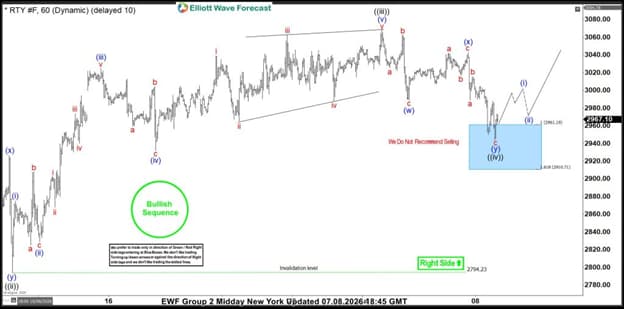
On July 8, 2026, we provided members with a 60-minute chart analysis of RTY following a pullback that completed a double zigzag structure. We identified a “Blue Box” zone—the area where we anticipated the next pivot, confirming the end of wave ((iv)) and the beginning of wave ((v)). Based on this technical setup, we recommended that members initiate long positions within the Blue Box.
Result: RTY bullish setup – 9th June 2026 update
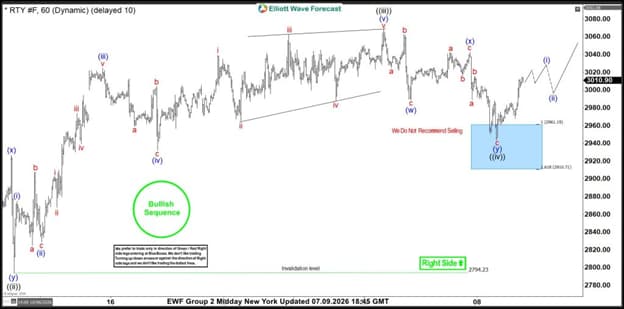
On June 9th, 2026—one day after our initial analysis—we shared the follow-up chart with our members. The RTY price action demonstrated a perfect reaction from the designated “Blue Box” zone, and the resulting bounce successfully hit our first target. Consequently, members secured partial profits while moving the remaining positions to breakeven. Looking ahead, the index is positioned to either extend its breakout for maximum profit or pull back into the next Blue Box zone, offering a fresh opportunity for our members to enter long positions.
Author

Elliott Wave Forecast Team
ElliottWave-Forecast.com

















