Rio Tinto (RIO): A rising trendline that has earned its reputation, and $98.00 is the next test

Something caught my attention on the daily chart of Rio Tinto (RIO) this week, and it wasn't the sharp recovery off the recent lows, though that's worth noting too. It was the trendline underneath all of it. This thing has been running since mid-2024, quietly doing its job, and every time I've come back to this chart over the past several months, it's still there, intact, with price respecting it like a floor that means something.
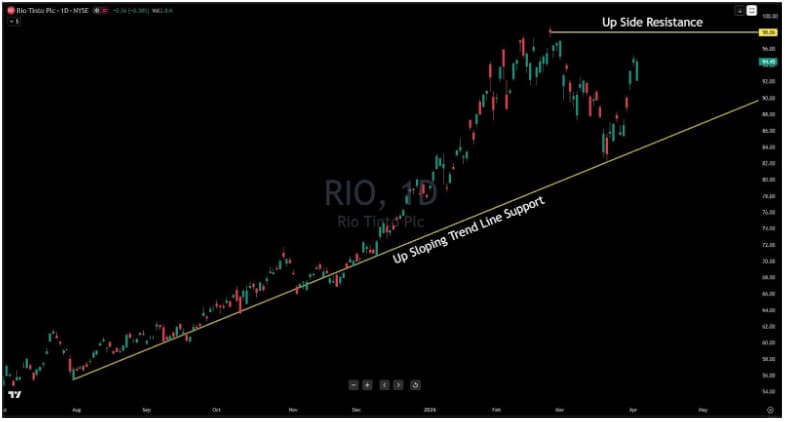
Rio Tinto is one of the world's largest mining and metals companies, extracting and processing iron ore, copper, aluminum, and lithium across some of the most resource-rich regions on the planet. The stock has a macro story attached to it, but what I care about here is the technical one, and that story starts with this up-sloping trendline that has produced a consistent pattern of higher lows going back nearly a year.
Think of that trendline as a staircase that buyers keep rebuilding. Every time price has pulled back into it, a new step has formed. We saw it in the fall. We saw it in early 2026. And we just saw it again.
Price came back hard toward that rising support, touched it, and is now recovering toward $94.45. That's three meaningful interactions with the same structure, and each one adds to the weight of what it represents. A trendline that gets tested and holds is not a coincidence. It's demand.
The overhead resistance at $98.06 is where the chart poses its most important question. RIO tagged that level earlier in the cycle and rejected hard. The selloff from $98.06 all the way back to the trendline was the market telling you exactly where the ceiling is. Price has now bounced and is working back toward it, which sets up the most important question on this chart: can RIO close above $98.06 on a confirmed daily basis?
My view is that the bulls are in the driver's seat for now, and the trendline is the reason. As long as price continues to post confirmed daily closes above that rising support, the structure is intact and the path toward $98.06 is the one I'm watching.
A confirmed close above that resistance level opens the door to fresh highs, and given how cleanly this chart has respected both levels, that's a setup worth monitoring with real discipline.
The bear case exists, but it needs confirmation to matter. The more often a support level gets tested, the more it asks of the buyers. We've had three interactions with this trendline now, and each one carries a little more pressure than the last. A confirmed daily close beneath it, not an intraday dip but a genuine close below, changes the picture and puts the $84 to $85 area back in focus as the next logical resting point.
The trendline has earned my respect. Until price tells me otherwise on a closing basis, RIO belongs to the bulls, and $98.06 is the level I'm watching to find out how much further this move has left in it.
Author

Benjamin Pool
Verified Investing
A seasoned financial expert with a passion for empowering individuals to mastering smart money management.


