Q3 earnings preview: High expectations, positive revisions, and broad-based growth

Key takeaways
- S&P 500 profits have now grown for 12 consecutive quarters, with momentum expanding beyond Tech.
- 2026 Q3 earnings estimates have remained on an upward trajectory, providing a positive backdrop.
- Q3 earnings for the S&P 500 index are expected to grow 22.3% YoY on 10.8% higher revenues.
The corporate earnings foundation remains exceptionally strong. S&P 500 profit growth has now posted 12 consecutive positive quarters, with momentum accelerating and expanding well beyond its initial Big Tech core. This sets a powerful backdrop as we finalize the Q2 earnings season—with just 32 S&P 500 members left to report—and turn our attention to Q3.
The quarterly chart below details actual results alongside Q3 2026 growth expectations and forward projections.
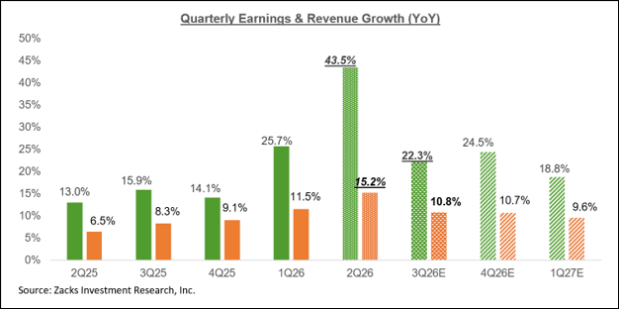
Image Source: Zacks Investment Research
As you can see here, 2026 Q3 earnings for the S&P 500 index are expected to increase by +22.3% from the same period last year on +10.8% higher revenues. This would follow the unusually strong showing in 2026 Q2, when earnings are on track to increase by +43.5% on +15.2% higher revenues.
The revisions trend has been positive, sustaining the favorable trend in place for almost a year now. The chart below shows how 2026 Q3 earnings growth expectations have evolved lately.
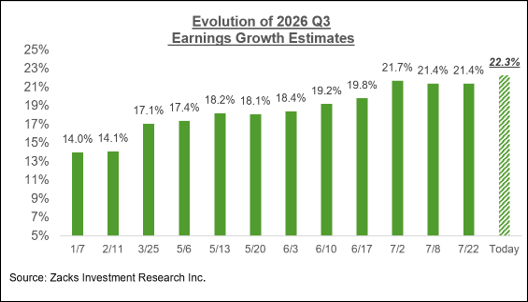
Image Source: Zacks Investment Research
As noted earlier, these favorable revision patterns are not a new development; they extend a tailwind that has been building for nearly a year.
Historically, these upward adjustments were tightly concentrated in Technology and, more recently, Energy following Middle East supply disruptions. However, for Q3 2026, the constructive estimate revisions have broadened significantly, rising across 8 of the 16 Zacks sectors—including Transportation, Finance, Aerospace, Industrials, Utilities, and Construction, alongside Tech and Energy.
Q2 earnings season scorecard
Through Friday, August 21st, we have seen quarterly results from 468 S&P 500 members, or 93.6% of the index’s total membership. Total earnings for these companies are up +40.6% from the same period last year on +14.1% revenue gains, with 84% of the companies beating EPS estimates and 76.9% of them beating revenue estimates.
The comparison charts below put the Q2 earnings and revenue growth rates for these index members in a historical context.
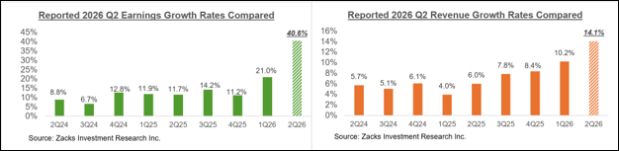
Image Source: Zacks Investment Research
The comparison charts below put the Q2 EPS and revenue beats percentages in a historical context.
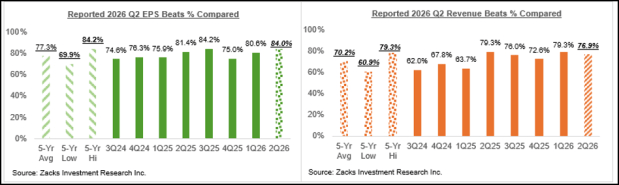
Image Source: Zacks Investment Research
The unusually strong earnings growth rate of +40.6% and revenue growth of +14.1% are benefiting from blockbuster results from Micron (MU - Free Report) and Alphabet (GOOGL - Free Report) .
The chart below shows the reported Q2 earnings growth pictures, with and without Alphabet and Micron.
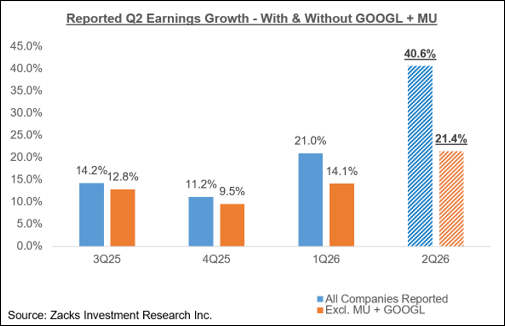
Image Source: Zacks Investment Research
The Q2 reporting cycle is in its final stretch now, with 9 of the 16 Zacks sectors having reported all of their results, including Energy, Finance, Construction, Basic Materials, Utilities, and others.
This week’s line-up includes more than 100 companies, including 18 S&P 500 members. Notable companies reporting this week, in addition to prominent retailers like Best Buy, Ulta Beauty, and others, include Nvidia, Salesforce, Agilent Technologies, and more.
The retail sector scorecard
For the Retail sector, we now have Q2 results from 24 of the 31 retailers in the S&P 500 index. Regular readers know that Zacks has a dedicated stand-alone economic sector for the retail space, which is unlike the placement of the space in the Consumer Staples and Consumer Discretionary sectors in the Standard & Poor’s standard industry classification.
The Zacks Retail sector includes not only Walmart, Target, and other traditional retailers, but also online vendors like Amazon (AMZN - Free Report) and restaurant players. The 24 Zacks Retail companies in the S&P 500 index that have already reported Q2 results include Walmart, Target, and others, as well as companies in the ecommerce and restaurant industries. We also have a number of restaurant companies on deck to report results this week.
Total Q2 earnings for these 24 retailers that have reported are up +11.9% from the same period last year on +10.8% higher revenues, with 83.3% beating EPS estimates and 62.5% beating revenue estimates.
The comparison charts below put the Q2 beats percentages for these retailers in a historical context.
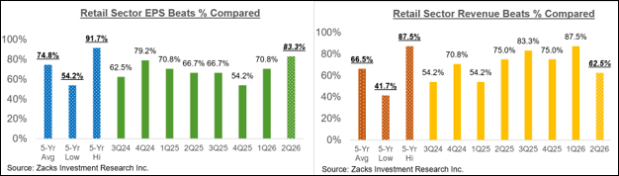
Image Source: Zacks Investment Research
As you can see above, the revenue beats percentages for these companies are tracking significantly below the historical averages for this group, but EPS beats are far more numerous.
With respect to earnings and revenue growth rates at this stage, we like to show the group’s performance with and without Amazon, whose results are among those of the 18 companies that have already reported. As we know, Amazon’s Q2 earnings were up +12.6% on +19.6% higher revenues, as it beat both EPS and top- line expectations.
The two comparison charts below show the Q2 earnings and revenue growth relative to other recent periods, both with Amazon’s results (left side chart) and without Amazon’s numbers (right side chart)
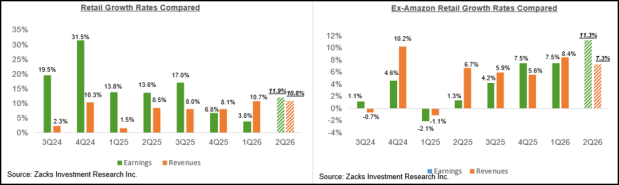
Image Source: Zacks Investment Research
As you can see above, earnings for the group outside of Amazon are up +11.3% on a +7.3% top-line gain.
The earnings big picture
The chart below shows the aggregate growth picture for the S&P 500 index on a calendar year basis.
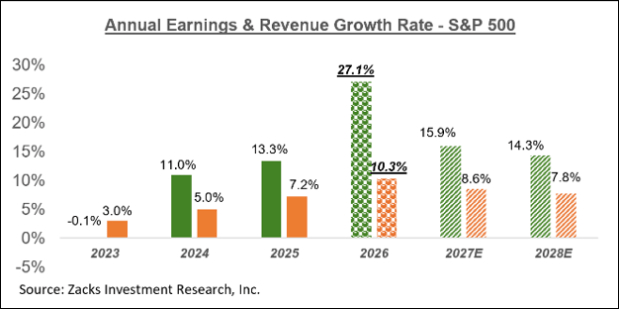
Image Source: Zacks Investment Research
As with Q2 expectations, the Tech sector has an outsized impact on the annual earnings picture as well. Total Tech sector earnings are expected to increase +50.6% from the same period last year on +27.5% higher revenues.
Excluding the Tech sector’s substantial contribution, total S&P 500 earnings for the year would be up +14.9% (vs. +27.1% otherwise).
As we have repeatedly flagged in this space in recent weeks, contributions from Alphabet (GOOGL - Free Report) , Micron (MU - Free Report) , and Nvidia (NVDA - Free Report) are also significant here, as the chart below shows.
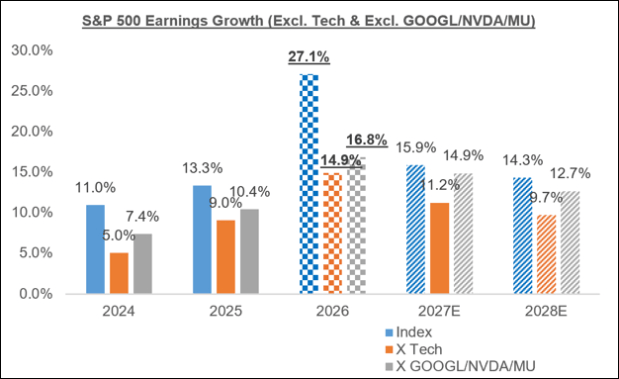
Image Source: Zacks Investment Research
Want the latest recommendations from Zacks Investment Research? Download 7 Best Stocks for the Next 30 Days. Click to get this free report
Author

Zacks
Zacks Investment Research
Zacks Investment Research provides unbiased investment research and tools to help individuals and institutional investors make confident investing decisions.
















