NZD/USD struggles near the 200-DMA around 0.7100 amid broad US dollar strength
- NZD/USD retreats from the 200-DMA as the US dollar trims early losses.
- The US Dollar Index advances to new year-to-date highs around 95.44.
- NZD/USD Technical outlook: A break above the 200-DMA would expose the 2021 high at 0.7465.

The NZD/USD retreats from three-day highs around 0.7100 though keeps in the green territory, advances some 0.07%, trading at 0.7051 during the New York session at the time of writing. In the last couple of hours, a rise in US Treasury yields underpinned the greenback with the US Dollar Index
DXY trades at new year-to-date highs around the 95.40s
The US Dollar Index, which measures the buck’s value against a basket of its peers, advances 0.31%, sitting at 95.42, hovering around year-to-date highs at 95.44
During the Asian and European session, the NZD rallied, topping around 0.7080 as the US dollar went under pressure, after a weaker than expected University of Michigan Consumer Sentiment data, which fell to 10-year lows amid higher inflation. Further, on the abovementioned sessions, falling US Treasury yields underpinned the buck’s which fell to three-day lows against the kiwi.
However, as American traders got to their desks, amid a light US economic docket, demand for the greenback increased, thus dragging the NZD/USD pair lower, down to last Friday’s high at 0.7048. In the meantime, the US 10-year benchmark note rose three basis points up to 1.613%.
This week, the Federal Reserve begins its bond taper, while the Reserve Bank of New Zealand (RBNZ) will host its last monetary policy of the year on November 24. Central bank monetary policy divergence between the Fed and the RBNZ would play a crucial role in the NZD/USD pair outlook, in which the NZD has the upper hand.
The market has priced in a 100% chance of a 25 bps hike by the RBNZ in its November meeting, but there is a slight 40% chance of a 50 bps. For 2022, investors are fully priced in for a 25 bps hike in February, with a 70% chance of a 50 bps hike.
NZD/USD Price Forecast: Technical outlook
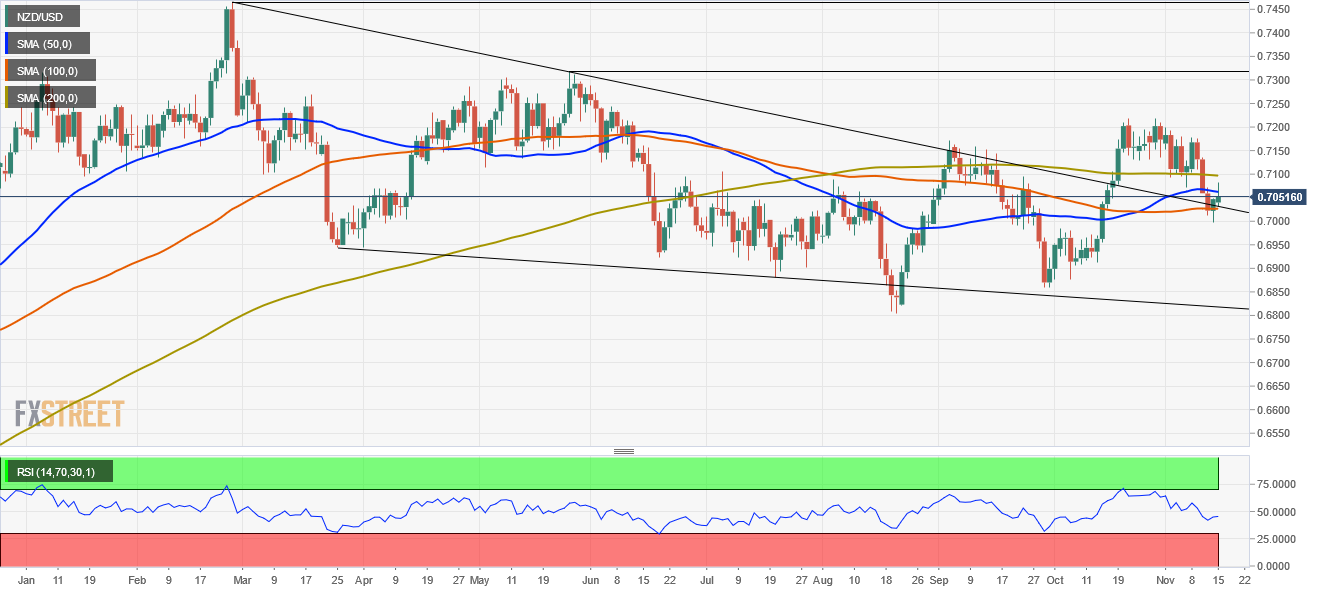
In the daily chart, the NZD/USD retreated from 0.7080s towards Friday’s high around 0.7048, within the 50 and 100-day moving averages (DMA’s). The daily moving averages (DMA’s) remain directionless but provide support/resistance levels in the pair. However, as the 200-DMA remains above the spot price, the pair is tilted to the downside, but it remains almost horizontally, at risk of being broken.
A break above the 200-DMA, which sits around 0.7100, could open the door for further gains. The first resistance would be 0.7200. A breach of the latter would expose crucial supply zones, like the May 26 high at 0.7317, followed by the year-to-date high at 0.7465.
Author

Christian Borjon Valencia
FXStreet
Markets analyst, news editor, and trading instructor with over 14 years of experience across FX, commodities, US equity indices, and global macro markets.
















