NZD/USD Price Forecast: Declining 20-day EMA warns of more downside
- NZD/USD jumps to near 0.5820 as the NZD outperforms despite weak NZ Q4 GDP data.
- The NZ economy grew at a moderate pace of 0.2% in the last quarter of 2025.
- Investors expect the Fed to hold interest rates steady for the entire year.

The NZD/USD pair trades 0.4% higher to near 0.5820 during the European trading session on Thursday. The Kiwi pair gains sharply as the New Zealand Dollar (NZD) outperforms despite disappointing New Zealand (NZD) Q4 Gross Domestic Product (GDP) data.
New Zealand Dollar Price Today
The table below shows the percentage change of New Zealand Dollar (NZD) against listed major currencies today. New Zealand Dollar was the strongest against the US Dollar.
| USD | EUR | GBP | JPY | CAD | AUD | NZD | CHF | |
|---|---|---|---|---|---|---|---|---|
| USD | -0.12% | -0.08% | -0.11% | -0.04% | -0.15% | -0.31% | -0.11% | |
| EUR | 0.12% | 0.04% | -0.02% | 0.07% | -0.03% | -0.20% | 0.00% | |
| GBP | 0.08% | -0.04% | -0.04% | 0.04% | -0.07% | -0.23% | -0.04% | |
| JPY | 0.11% | 0.02% | 0.04% | 0.07% | -0.05% | -0.24% | 0.00% | |
| CAD | 0.04% | -0.07% | -0.04% | -0.07% | -0.11% | -0.29% | -0.08% | |
| AUD | 0.15% | 0.03% | 0.07% | 0.05% | 0.11% | -0.17% | 0.03% | |
| NZD | 0.31% | 0.20% | 0.23% | 0.24% | 0.29% | 0.17% | 0.20% | |
| CHF | 0.11% | -0.01% | 0.04% | -0.01% | 0.08% | -0.03% | -0.20% |
The heat map shows percentage changes of major currencies against each other. The base currency is picked from the left column, while the quote currency is picked from the top row. For example, if you pick the New Zealand Dollar from the left column and move along the horizontal line to the US Dollar, the percentage change displayed in the box will represent NZD (base)/USD (quote).
Earlier in the day, Stats NZ reported that the economy grew by 0.2%, slower than estimates of 0.4% and the 0.9% growth seen in the third quarter of 2025, revised lower from 1.1%. On an annualized basis, the NZ GDP growth arrived at 1.3%, lower than estimates of 1.7%, but higher than the previous reading of 1.1%, revised lower from 1.3%.
Meanwhile, analysts at ANZ have warned that the spike in oil prices amid Middle East conflicts is expected to prompt inflation in the near term and weigh on the economic outlook.
During the press time, the US Dollar (USD) clings to Wednesday’s gains, with the US Dollar Index (DXY) hovering around 100.20. The outlook of the US Dollar has turned broadly upbeat as traders expect the Federal Reserve (Fed) to hold interest rates steady in the entire year, according to the CME FedWatch tool.
NZD/USD technical analysis
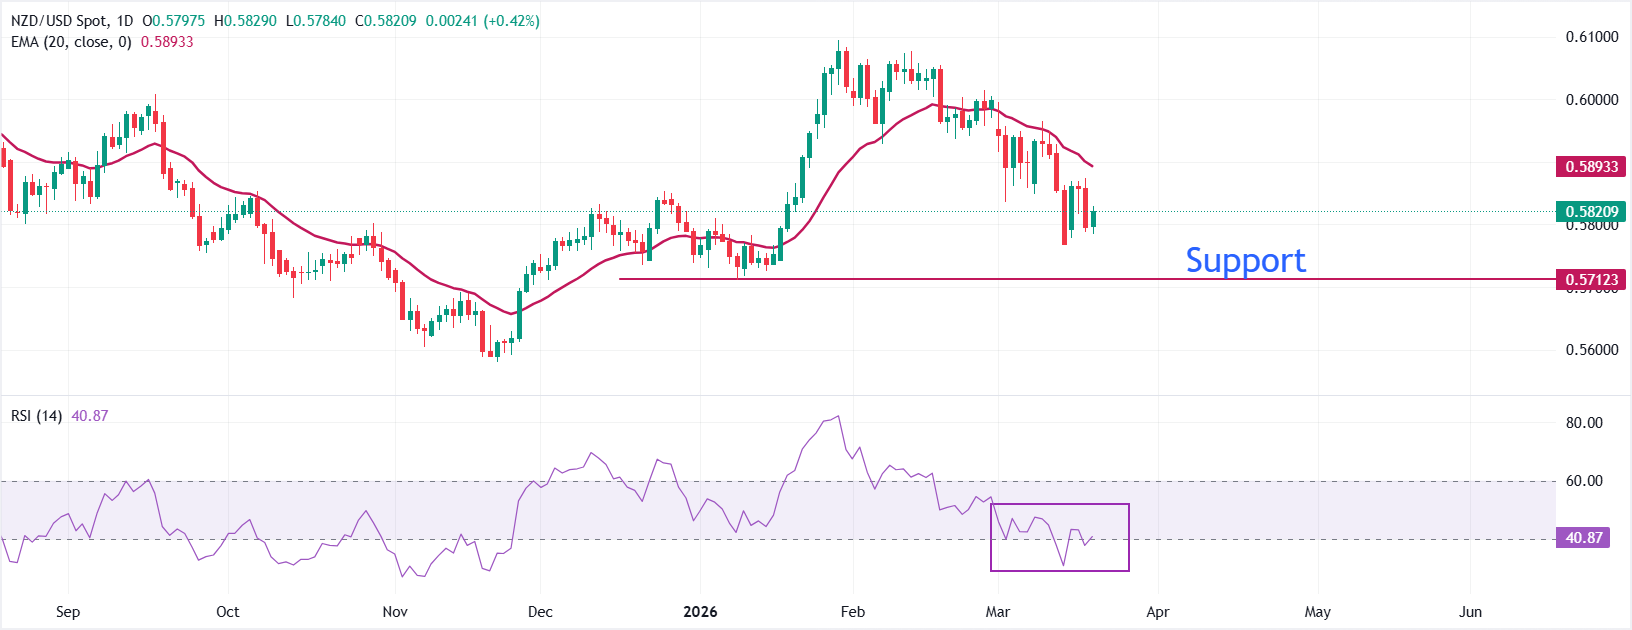
NZD/USD climbs to near 0.5820 as of writing. However, the near-term bias is bearish as price holds below the descending 20-day Exponential Moving Average (EMA), confirming that recent rebounds have been contained within a broader downswing from the early-month highs near 0.6050.
The 14-day Relative Strength Index (RSI) near 40 for almost a week signals that bears are in control and more downside is highly likely.
Immediate support is located at the recent trough around 0.5770, and a clear break beneath this floor would extend the decline toward the January low of 0.5711. On the upside, initial resistance emerges at the 0.5860 area, aligning with last week’s reaction high and preceding the 20-day EMA near 0.5890, where a daily close above would be needed to ease the current downside pressure and open the way to 0.5930.
(The technical analysis of this story was written with the help of an AI tool.)
Economic Indicator
Gross Domestic Product (QoQ)
The Gross Domestic Product (GDP), released by Statistics New Zealand on a quarterly basis, is a measure of the total value of all goods and services produced in New Zealand during a given period. The GDP is considered as the main measure of New Zealand’s economic activity. The QoQ reading compares economic activity in the reference quarter to the previous quarter. Generally, a high reading is seen as bullish for the New Zealand Dollar (NZD), while a low reading is seen as bearish.
Read more.Last release: Wed Mar 18, 2026 21:45
Frequency: Quarterly
Actual: 0.2%
Consensus: 0.4%
Previous: 1.1%
Source: Stats NZ
The Gross Domestic Product (GDP), released by Statistics New Zealand, highlights the overall economic performance on a quarterly basis. The gauge has a significant influence on the Reserve Bank of New Zealand’s (RBNZ) monetary policy decision, in turn affecting the New Zealand dollar. A rise in the GDP rate signifies improvement in the economic conditions, which calls for tighter monetary policy, while a drop suggests deterioration in the activity. An above-forecast GDP reading is seen as NZD bullish.
Author

Sagar Dua
FXStreet
Sagar Dua is associated with the financial markets from his college days. Along with pursuing post-graduation in Commerce in 2014, he started his markets training with chart analysis.














