NZD/USD Price Forecast: Bears break 0.5800 as Kiwi slide deepens
- NZD/USD breaks the July cycle low, confirming broader bearish structure.
- RSI points lower as sellers maintain control of momentum.
- Break below 0.5750 exposes 0.5700 and 0.5672 next.

The New Zealand Dollar (NZD) tumbles against the US Dollar (USD) on Tuesday for the second straight day this week, down 0.37% as risk appetite sours, with AI company CEOs expressing concerns about the rapid pace of evolution and as high energy prices push markets to expect further tightening by the Federal Reserve (Fed). At the fime of writing, NZD/USD trades at 0.5757 after touching a two-month low of 0.5750.
NZD/USD Price Forecast: Technical Outlook
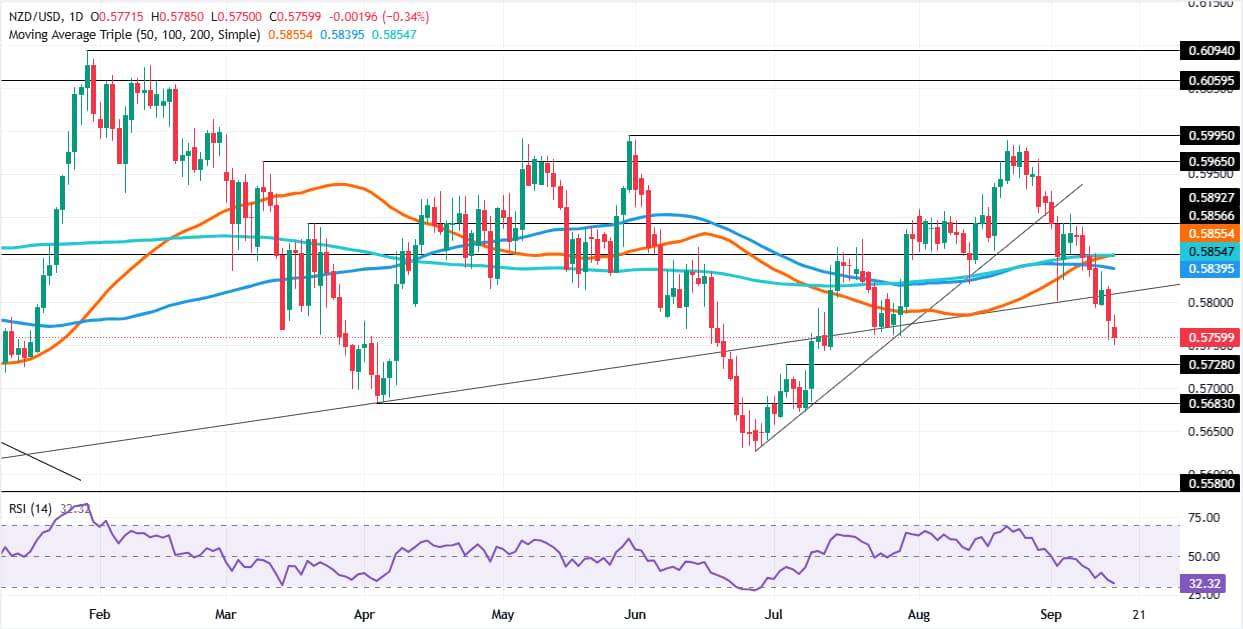
Price action shows the NZD/USD downtrend remains intact after clearing the 0.5800 figure and also the latest cycle low of July 29 at 0.5761, clearing the way for further downside.
The Relative Strength Index (RSI) shows that bearish momentum continued to build, indicating further NZD/USD downside.
The first key support is at 0.5750, followed by 0.5700. Beneath this level is the July 7 low of 0.5672, followed by the year-to-date low of 0.5626.
For a bullish reversal, buyers must reclaim 0.5800 to challenge the confluence of daily SMAs at around 0.5839-0.5855.
NZD/USD Price Chart – Daily
New Zealand Dollar Price Today
The table below shows the percentage change of New Zealand Dollar (NZD) against listed major currencies today. New Zealand Dollar was the strongest against the Japanese Yen.
| USD | EUR | GBP | JPY | CAD | AUD | NZD | CHF | |
|---|---|---|---|---|---|---|---|---|
| USD | 0.06% | 0.15% | 0.50% | 0.09% | 0.10% | 0.34% | 0.18% | |
| EUR | -0.06% | 0.09% | 0.41% | 0.03% | 0.04% | 0.28% | 0.11% | |
| GBP | -0.15% | -0.09% | 0.33% | -0.08% | -0.05% | 0.16% | 0.02% | |
| JPY | -0.50% | -0.41% | -0.33% | -0.40% | -0.39% | -0.16% | -0.32% | |
| CAD | -0.09% | -0.03% | 0.08% | 0.40% | 0.01% | 0.24% | 0.08% | |
| AUD | -0.10% | -0.04% | 0.05% | 0.39% | -0.01% | 0.22% | 0.06% | |
| NZD | -0.34% | -0.28% | -0.16% | 0.16% | -0.24% | -0.22% | -0.15% | |
| CHF | -0.18% | -0.11% | -0.02% | 0.32% | -0.08% | -0.06% | 0.15% |
The heat map shows percentage changes of major currencies against each other. The base currency is picked from the left column, while the quote currency is picked from the top row. For example, if you pick the New Zealand Dollar from the left column and move along the horizontal line to the US Dollar, the percentage change displayed in the box will represent NZD (base)/USD (quote).
Author

Christian Borjon Valencia
FXStreet
Markets analyst, news editor, and trading instructor with over 14 years of experience across FX, commodities, US equity indices, and global macro markets.