|

NZD/USD Price Analysis: Promising outlook, bulls could confirm a recovery

  • NZD/USD rose by 0.70% on Thursday to 0.6180.
  • The RSI is in positive territory with a rising slope, suggesting that buying pressure is increasing
  • If the bulls secure the 20-day SMA at 0.6185, it could confirm a recovery of the buying traction.

In Thursday's session, the New Zealand Dollar appreciated against its US counterpart, recovering from the previous session's decline. The NZD/USD pair moved up by 0.75% to a high of 0.6180, as the bulls took control of the market.

The Relative Strength Index (RSI) is currently at 55, which is in positive territory and has a rising slope, suggesting that the bulls are gaining momentum. The Moving Average Convergence Divergence (MACD) printed decreasing red bars, a sign of a potential reversal in the bearish momentum. This is aligned with the recent price action, which shows the bulls are pushing back.

NZD/USD daily chart

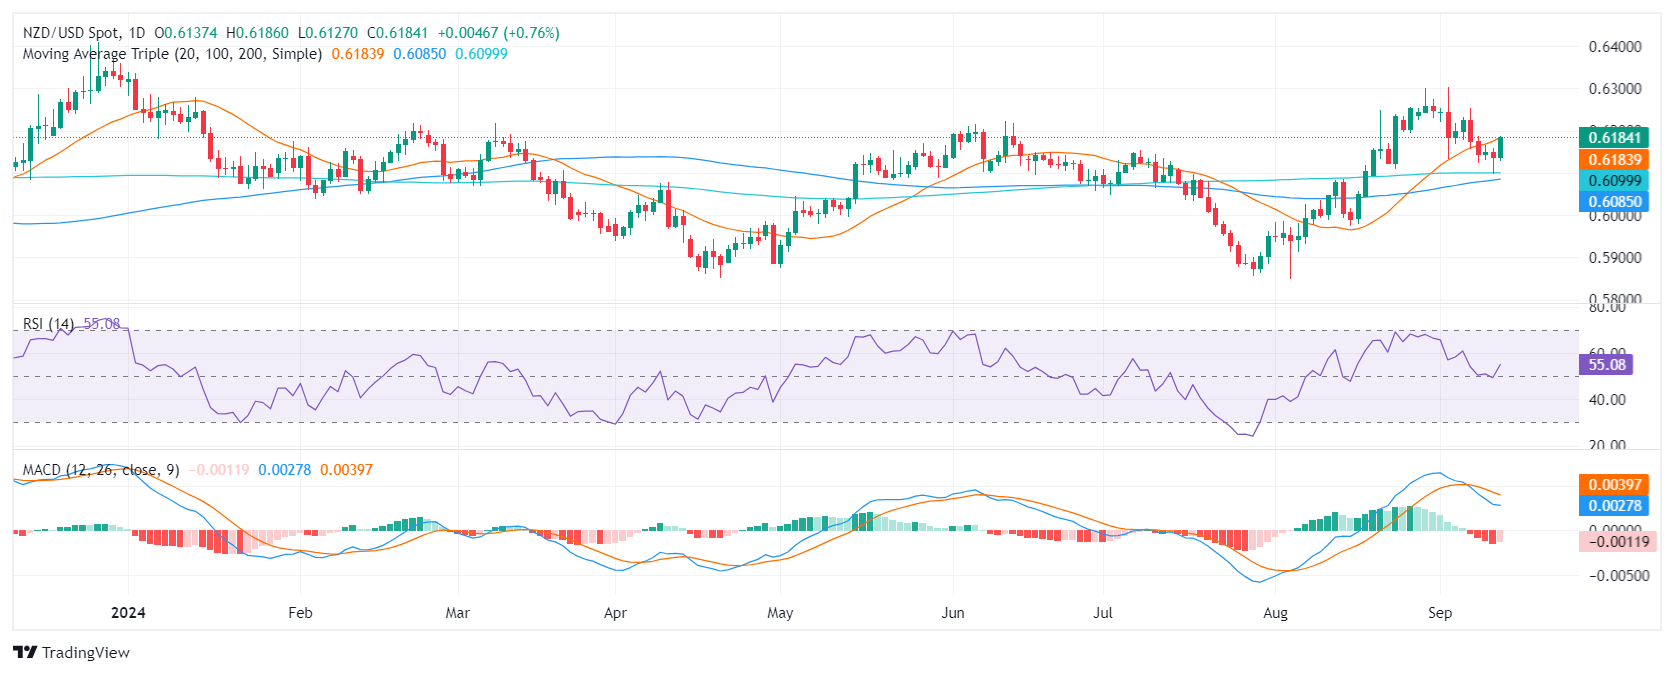
Key support levels to watch are 0.6120, 0.6140, and 0.6160, while resistance levels are 0.6185 (20-day Simple Moving Average), 0.6210, and 0.6230. A consolidation above the 0.6200 would put the pair back above the 20,100 and 200-days SMA which could trigger additional upwards movements.

Author

Patricio Martín

Patricio is an economist from Argentina passionate about global finance and understanding the daily movements of the markets.

More from Patricio Martín
Share:

Editor's Picks

EUR/USD stays below 1.1850 as Fed policy signals weigh on sentiment

EUR/USD edges modestly higher after opening with a downside gap, trading near 1.1840 during Monday’s Asian session. However, the pair remains vulnerable to further downside as the US Dollar finds support following President Donald Trump’s nomination of Kevin Warsh as the next Federal Reserve Chair.

GBP/USD holds steady near 1.3700 as markets assess Warsh's Fed outlook

The GBP/USD pair trades on a flat note near 1.3695 during the early Asian session on Monday. Traders weigh what a Federal Reserve under Kevin Warsh might look like. The US ISM Manufacturing Purchasing Managers Index report will be published later on Monday. 

Gold: Will it defend 21-day SMA on a daily closing basis?

Gold halts its correction as sellers take a breather, with the NFP week kicking in. The US Dollar fades its recovery stint as markets weigh a Fed under Warsh. Geopolitical tensions seem to ease. Technically, RSI flirts with midline on the daily chart; Gold is at a critical crossroads.

Bitcoin slips below $75,000 as selling pressure accelerates

Bitcoin (BTC) price falls below the $75,000 mark on Monday, having corrected nearly 11% in the previous week and reaching level not seen in nearly 10 months. Market momentum has clearly turned bearish, with technical indicators pointing to further downside toward the next key support at $70,000.

Global central banks hold steady as EMs signal easing ahead

Central banks across both G10 and emerging markets met this week, with most opting to keep policy rates unchanged. Canada, Sweden, Brazil and Chile all held rates steady. Beyond central bank decisions, the Eurozone's solid Q4 GDP growth bolstered the case for the ECB to keep policy rates unchanged next week.

Bitcoin slips below $75,000 as selling pressure accelerates

Bitcoin (BTC) price falls below the $75,000 mark on Monday, having corrected nearly 11% in the previous week and reaching level not seen in nearly 10 months. Market momentum has clearly turned bearish, with technical indicators pointing to further downside toward the next key support at $70,000.