|

NZD/JPY Price Analysis: Bearish momentum intensifies, threatening 91.00

  • NZD/JPY extends downtrend, breaking below key support.
  • Technical indicators suggest further downside potential.
  • The overall picture sees the pair stuck in a side-ways trading channel.

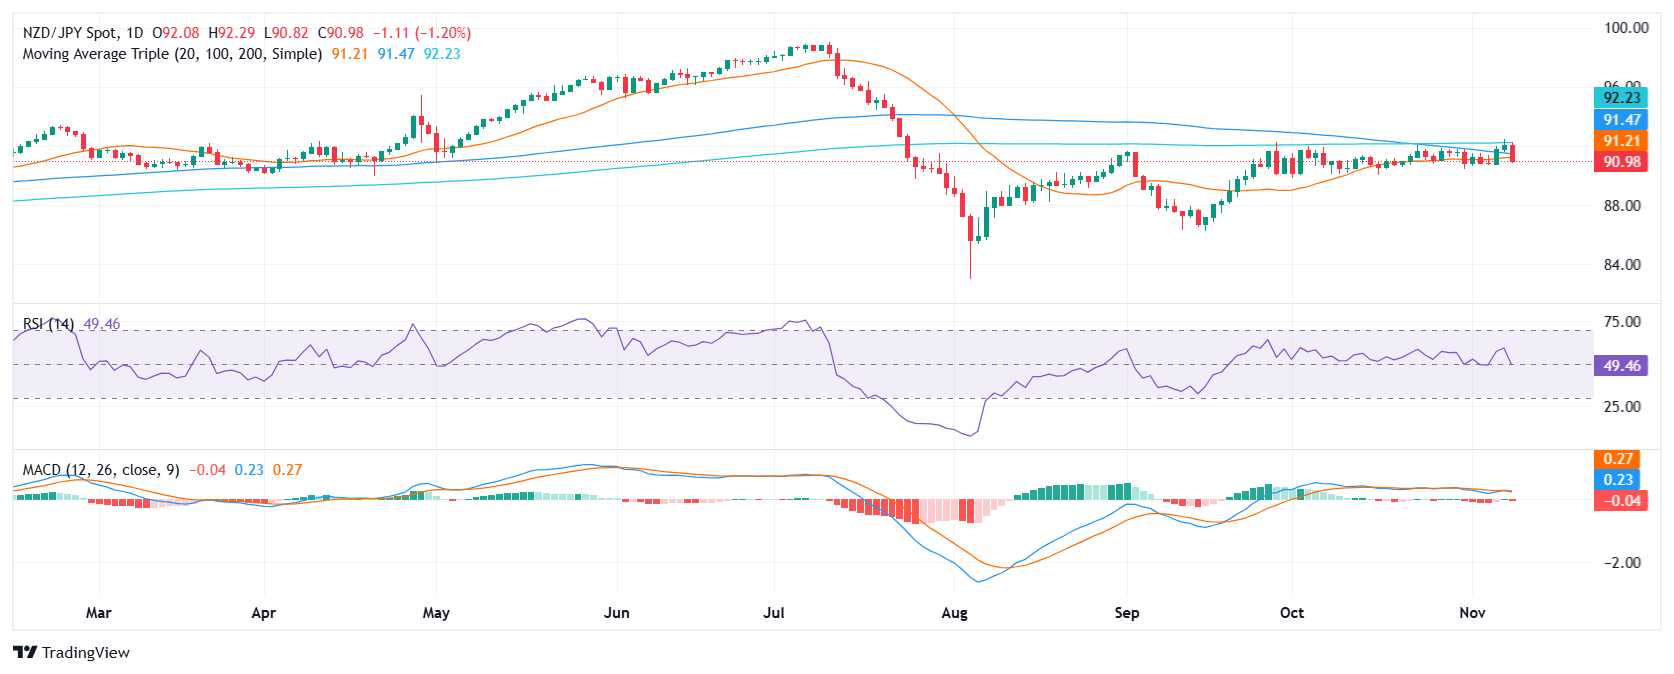
In Friday's session, the NZD/JPY declined by 1.20% to 91.00, continuing its bearish momentum. This break below the crucial 91.00 support level and the convergence of the 20 and 100-day Simple Moving Averages (SMAs) further confirms the strength of the selling pressure.

The analysis of technical indicators reveals a bearish outlook. The Relative Strength Index (RSI) has fallen into the negative territory and is declining sharply, indicating increasing selling pressure. The Moving Average Convergence Divergence (MACD) is also indicating rising selling momentum, as the histogram is red and rising.

Based on these observations, the NZD/JPY pair is expected to continue its downward trajectory. The initial support level to watch is 90.80, followed by 90.50 and then 90.30. On the upside, the first resistance level is 91.50, followed by 91.80 and 92.00.

NZD/JPY daily chart

Author

Patricio Martín

Patricio is an economist from Argentina passionate about global finance and understanding the daily movements of the markets.

More from Patricio Martín
Share:

Markets move fast. We move first.

Orange Juice Newsletter brings you expert driven insights - not headlines. Every day on your inbox.

By subscribing you agree to our Terms and conditions.

Editor's Picks

EUR/USD: Bulls pray for a dovish Fed

EUR/USD has finally taken a breather after a pretty energetic climb. The pair broke above 1.1680 in the second half of the week, reaching its highest levels in around two months before running into some selling pressure. Even so, it has gained almost two cents from the late-November dip just below 1.1500 the figure.

GBP/USD trims gains, recedes toward 1.3320

GBP/USD is struggling to keep its daily advance, coming under fresh pressure and retreating to the 1.3320 zone following a mild bullish attempt in the Greenback. Even though US consumer sentiment surprised to the upside, the US Dollar isn’t getting much love, as traders are far more interested in what the Fed will say next week.

Gold: Bullish momentum fades despite broad USD weakness

After rising more than 3.5% in the previous week, Gold has entered a consolidation phase and fluctuated at around $4,200. The Federal Reserve’s interest rate decision and revised Summary of Economic Projections, also known as the dot plot, could trigger the next directional move in XAU/USD. 

Week ahead: Rate cut or market shock? The Fed decides

Fed rate cut widely expected; dot plot and overall meeting rhetoric also matter. Risk appetite is supported by Fed rate cut expectations; cryptos show signs of life. RBA, BoC and SNB also meet; chances of surprises are relatively low. Dollar weakness could linger; both the aussie and the yen best positioned to gain further. Gold and oil eye Ukraine-Russia developments; a peace deal remains elusive.

Week ahead – Rate cut or market shock? The Fed decides

Fed rate cut widely expected; dot plot and overall meeting rhetoric also matter. Risk appetite is supported by Fed rate cut expectations; cryptos show signs of life. RBA, BoC and SNB also meet; chances of surprises are relatively low.

Ripple faces persistent bear risks, shrugging off ETF inflows

Ripple is extending its decline for the second consecutive day, trading at $2.06 at the time of writing on Friday. Sentiment surrounding the cross-border remittance token continues to lag despite steady inflows into XRP spot ETFs.