NQ 100 bulls aiming at 88.6% Fib at 25,858
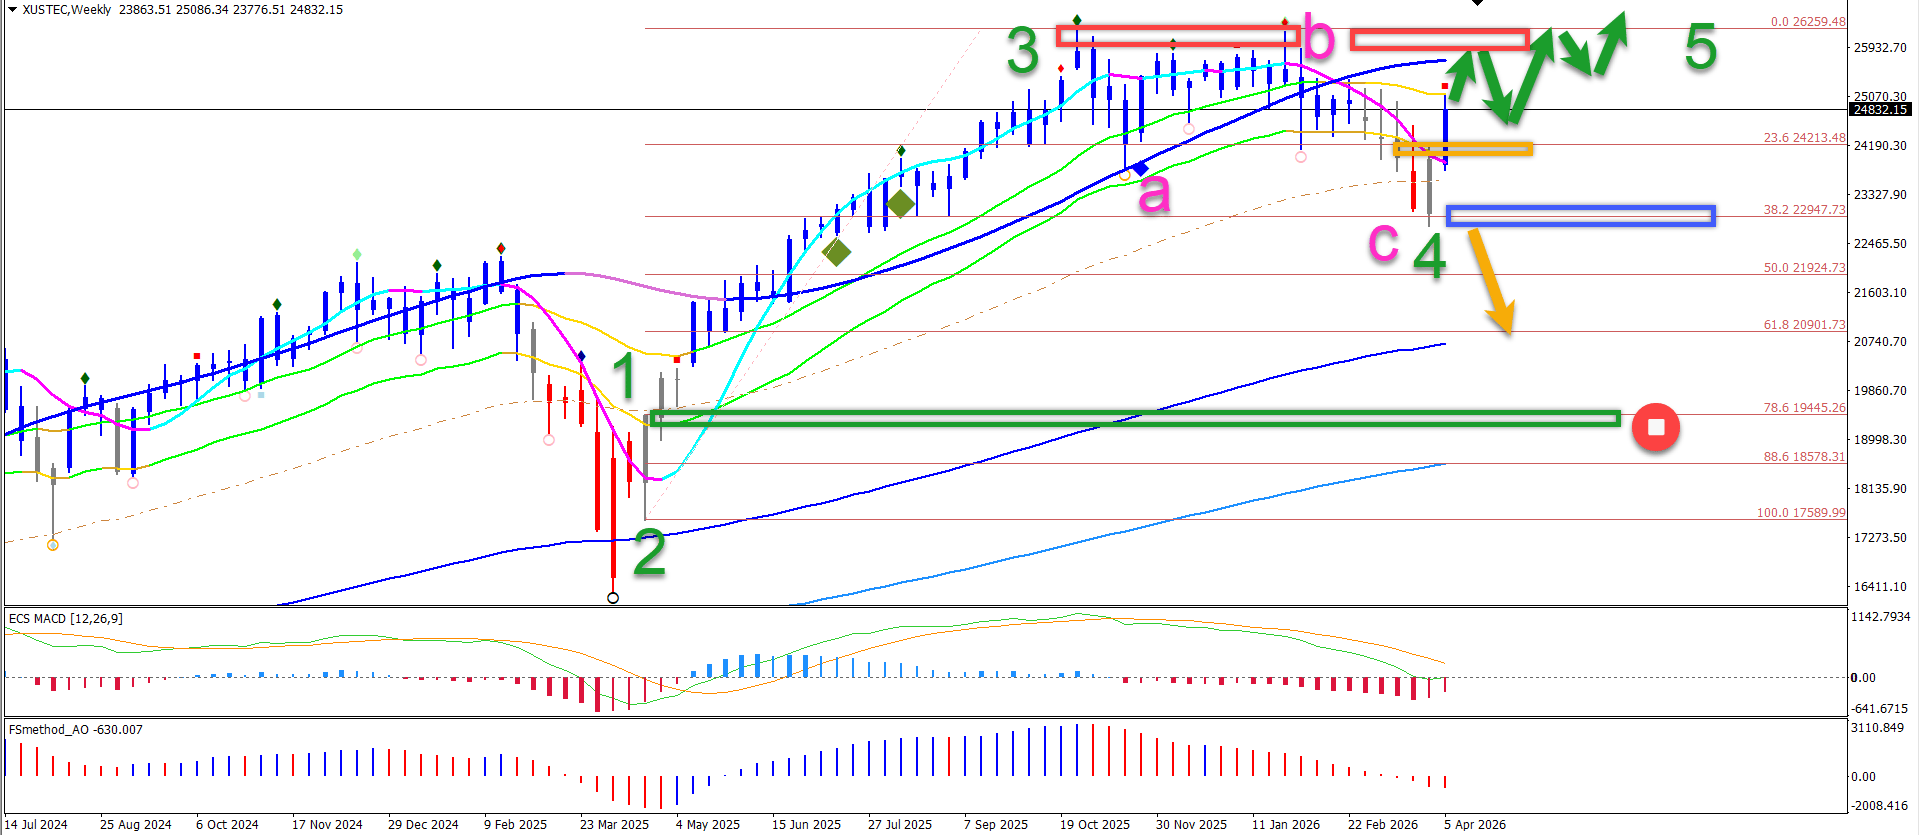
The Nasdaq has made a dramatic bullish breakout this week above the candle high of last week (orange box). The reversal happened at a 38.2% Fibonacci retracement level (blue box), which seems to complete an ABC pattern (pink) within wave 4 (green).
Weekly chart
A new higher high is most probable
Despite all of the geopolitical, economic, and technological circumstances testing the financial markets this year – an uptrend continuation seems most likely at the moment.
However, the uptrend could be volatile and choppy – something which is not uncommon in wave 5 (green). Especially considering all of the volatile news that has been dominating the headlines.
Here are the three main scenarios:
- Green arrows indicate truncated wave 5: a choppy uptrend is likely to break the top for a wave 5 but with lots of volatility and hesitation – especially close to the double top (red box). Sometimes truncated waves 5 do not even manage to break the top.
- Orange arrow indicates a larger bearish correction or reversal: a break below the 38.2% Fibonacci level will see price probably fall back to the 144 ema long-term average.
- Red stop sign indicates an invalidation of this Elliott Wave pattern: a break below the top of wave 1 (green) means that the current analysis is invalid and a reversal is likely.
Four-hour chart

Bullish price action above 21 ema zone and ET zone 6
Price action showed strong bullish momentum with 8+ candles not hitting the 21 ema zone (green diamond). Price has also reached ET zone 7, which further confirms that price action is an impulsive phase.
Here are the main levels to monitor:
- Green arrows: uptrend continues soon for a move towards ET target zone 7 and 8. Price is likely to test the deeper 78.6% and 88.6% Fibonacci resistance levels of the entire bearish correction.
- Blue arrow: uptrend continues after price action tests the 21 ema support zone.
- Red arrow: a strong bearish reaction is expected to occur at 78.6% or 88.6% Fibonacci retracement level – or otherwise at the double top resistance.
- Orange arrow: the uptrend fails to follow through and a deeper correction takes place below the support.
- Pink arrow: a test of the previous bottom is likely to find support.
Author

Chris Svorcik
FS method
Chris Svorcik is a trader, analyst, and educator with over 15 years of experience in financial markets, specializing in moving averages, market structure, and price patterns.


