News cycle just flipped again: Iran, earnings put S&P 7,300 in play

Markets just got another sharp turn in the tape.
Iran has reportedly just sent a fresh proposal for negotiations with the U.S. through Pakistani mediators, oil eased on the news, and earnings are still doing enough to keep buyers engaged. That combination has pushed the S&P 500 back toward the 7,300 area, or close enough that traders now have to treat it as a live level. After the move into 7,265, the gap is not that wide anymore.
That does not mean 7,300 has to print exactly.
It means the market is already close enough for the bigger question to take over: does this good-news wave still have enough fuel to squeeze a little further, or is it setting up the sort of peak that gets followed by a mid-year shakeout?
In this piece, we’re looking at three things now shaping the next move:
- Why Tom Lee’s 7,300 projection is suddenly within reach
- Why SOX/SPX may decide whether the S&P 500 squeeze has real backing
- Why midterm-year seasonality puts “Sell in May” risk back on the table
SOX/SPX is where the caution starts
The cleaner warning sign is not the S&P 500 itself. It is SOX/SPX.
SOX is the semiconductor index. Comparing it with the S&P 500 shows whether chip stocks are still outperforming the broader market.
For an AI-led rally, that ratio tells you whether the market’s strongest theme is still doing the heavy lifting.
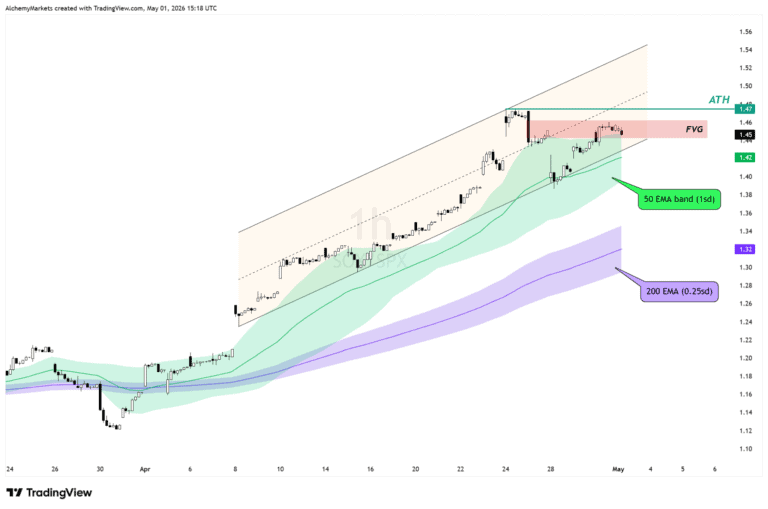
Right now, SOX/SPX is sitting in a potential rejection zone.
The ratio is pressing into the 1.45 to 1.46 area, where the fair value gap sits. However, a more interesting level would be the midline of the rising channel, which is near 1.47.
If semiconductors are stalling here or grinds higher, the index can still squeeze a little higher on earnings and improving Iran headlines.
However, if a breakdown begins, S&P 500 should begin to weaken as it is currently sustained by AI earning headlines.
7,300 may come first, then the risk changes
The S&P 500 chart is now less about whether the rebound worked and more about how far this squeeze can still go.
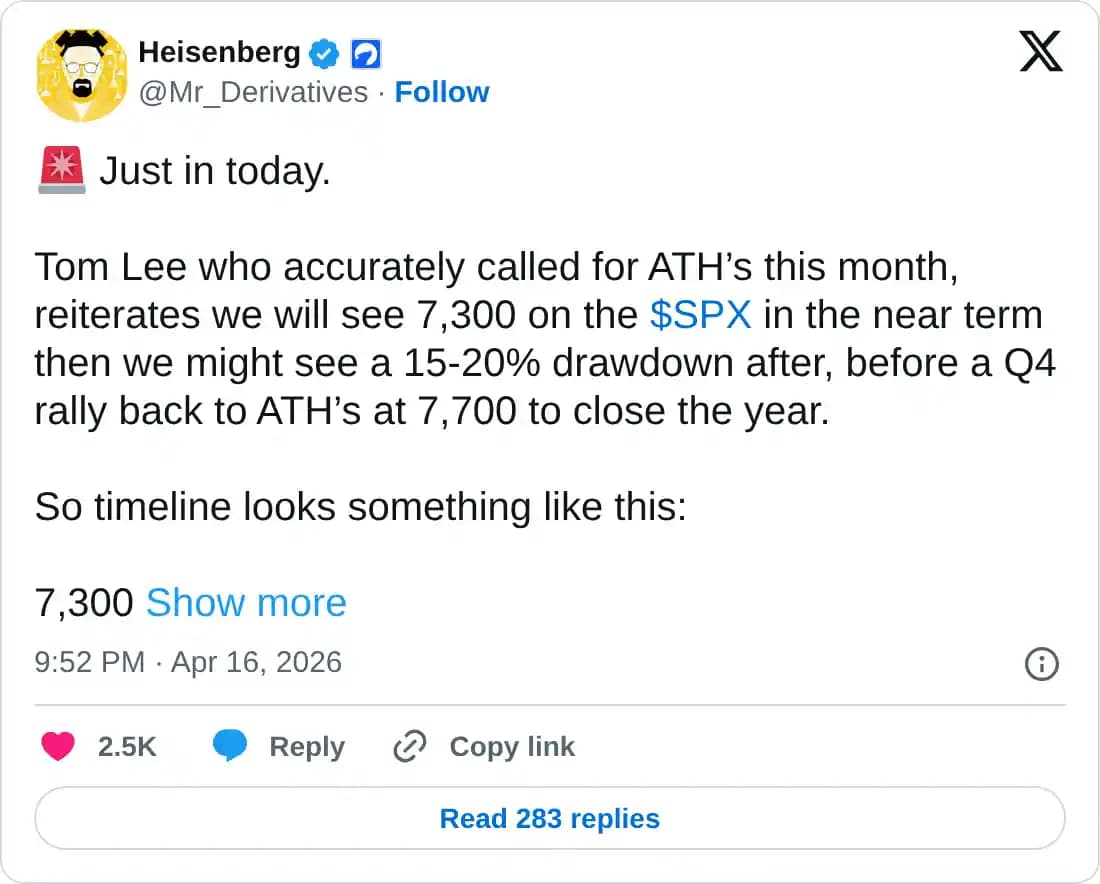
One projection making the rounds recently comes from Tom Lee of Fundstrat. Lee has argued that the S&P 500 can still push toward 7,300, helped by resilient earnings, easing inflation pressure and a market that has not fully chased the rally yet.
Separately, he has also said an S&P 500 move above 7,700 this year is “very probable,” after markets moved past early-year risks around Iran, private credit and Fed uncertainty.
That fits the current setup, but not as a straight-line melt-up story.
The S&P 500 has already traded into 7,265, so 7,300 does not need some heroic final leg. It only needs the current good-news wave to last a little longer.
Our read is that 7,300 is the interesting zone, not because it has to stop the market exactly, but because the risk-reward starts to change once price gets there.
If semiconductors regain momentum and SOX/SPX pushes through its own resistance, the S&P 500 can still stretch beyond 7,300. In that case, the next upside references sit around 7,395 to 7,400, then 7,650 if momentum keeps running.
But those higher levels only matter if leadership holds underneath the surface.
If chip leadership keeps stalling while the S&P 500 pushes into 7,300, the move starts to look less like a fresh breakout and more like the final squeeze before correction risk takes over.
Sell in May fits the path better after 7,300, not before
Take a look at this Midterm Election year seasonality chart from Artemis from February 2026 – it’s the typical price movement of S&P 500 during midterm election years.
Surprisingly, the path lines up extremely well with Tom Lee’s projections. May typically is a weaker month for the S&P leading into June, where the price then recovers and makes a new ATH into December.
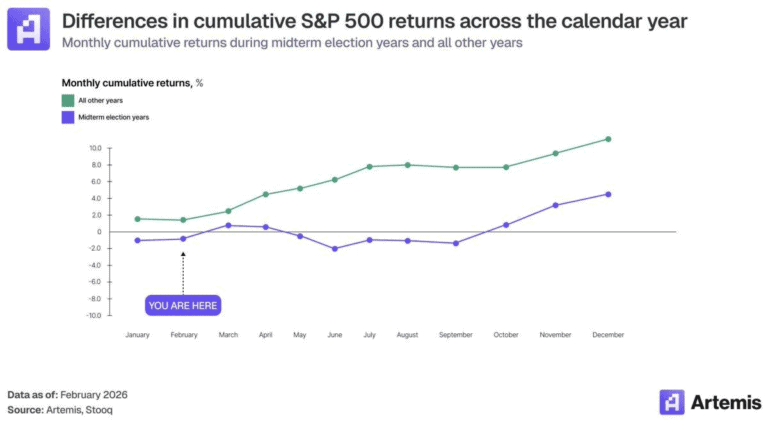
Although this is not a forecast, it is based on historical averages. So if the path ensues, we could see the following happen:
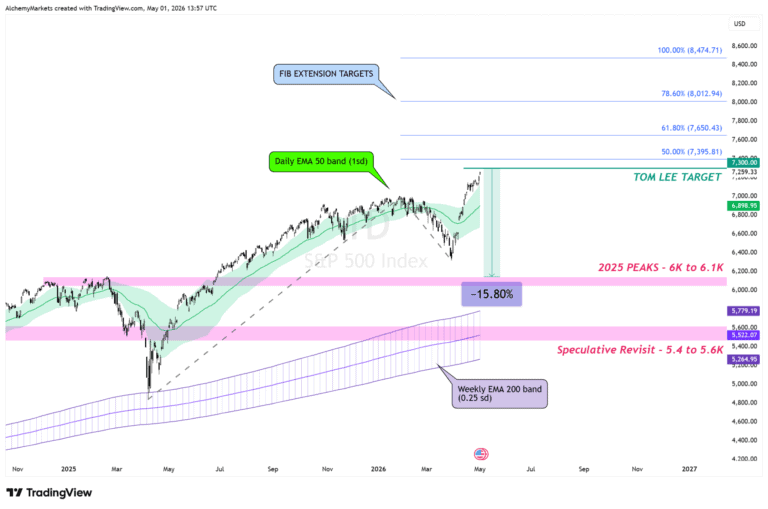
- After consolidating near our current levels (potentially tapping $7,300), S&P 500 drops 15-20%.
- This pullback brings us back to the 2025 peaks at ~$6,000.
- Another rally begins around June, allowing S&P to remain bullish to year end.
The year end targets could be near $7,700 as Tom Lee projected, but if not, Fib Extension levels could be good targets as well. Only time will tell if this typical mid-term pathing will rhyme true again in 2026.
Bottom line
Iran coming back to the table, softer oil and firm earnings have been enough to put S&P 7,300 back in play. But the more important read is underneath the headline index.
SOX/SPX is already in a potential rejection zone. If chip leadership pushes through it, the S&P 500 can still squeeze higher and 7,300 becomes easier to reach.
If chip leadership keeps stalling there, the index may still get close enough to test that area, but the move starts to look more like the last push of the leg than the start of a fresh one.
Author

Zorrays Junaid
Alchemy Markets
Zorrays Junaid has extensive combined experience in the financial markets as a portfolio manager and trading coach. More recently, he is an Analyst with Alchemy Markets, and has contributed to DailyFX and Elliott Wave Forecast in the past.


