NASDAQ100: Higher first before lower again?

Summary: A break above $19221, without going below last week’s low first, can target $19550+ from where the next leg lower to at least $17800+/-100 can start, contingent on staying below the August high.
Our warning levels facilitated an easy 800p trade.
In our last update from late August, see here, we assessed, using the Elliott Wave Principle (EWP), whether the NASDAQ100 (NDX) was ready to move lower and found that
“The index has dropped below the blue first warning level and is holding the grey second warning level [at $19250]. A daily close below will be a good sign that the next leg lower has started, with a break below the orange level at $18450, essentially the second-to-last nail in the Bulls’ coffin.”
Four trading days later, the index broke below those grey and orange warning levels and bottomed, so far, on Friday, September 6, at $18450. That was an easy 800p trade. It has since staged a rally back to almost $19000. Thus, our calls since early July have mostly been correct thanks to the EWP and not by listening to news, pundits, etc. Because in the end, only price pays. Price is the final arbiter. It is the aggregate opinion of all market participants and, thus, the most important. Understanding price movement means understanding the market. The EWP is price-based and, thus, one of the most critical tools in a trader’s arsenal.
We will assess the index in more detail in today's update using the hourly charts. See Figure 1 below.
Figure 1. NDX hourly chart with detailed EWP count and technical indicators
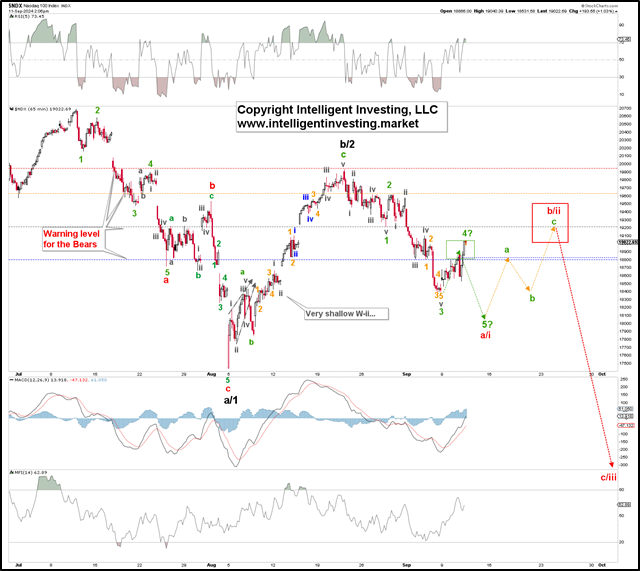
So far, the index has most likely only fallen in three waves from its August bounce high. The current three-day rally can be part of a 4th wave, but it must stay below $19221, the potential green W-1 low, to allow for another leg lower, the green W-5. If the index moves above that level, and it is already getting close, we shift our focus to at least another three-legged rally. See Figure 2 below.
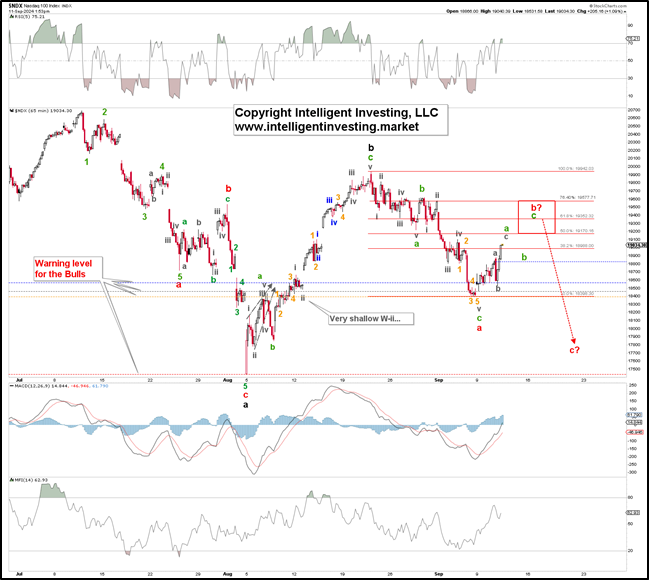
Figure 2. NDX daily chart with detailed EWP count and technical indicators
Three waves vs five waves
Namely, after three waves lower, we must always expect at least three waves back up because corrections (comprising three waves: A, B, C) can always become protracted (an ABC can morph into an AB-abc). Thus, a three-wave counter-trend rally, the red W-b? to ideally $19350+/-125, should be underway at this stage. The red W-b? should subdivide into the three green waves a-b-c, from where the red W-c? should emerge, bringing the index price down to at least $17800+/-100, depending on where exactly W-b will end.
Thus, contingent on holding above last week’s low, we should allow the index to rally to ideally $19350+/-125. A move above the August high is required to damage the Bears’ case seriously. Conversely, if the Bears can hold the index below $19221 and drop price below last Friday’s low, we should anticipate $18000+/-100 before the next meaningful count-trend rally back to ideally $19300+/-200 can be expected.
Author

Dr. Arnout Ter Schure
Intelligent Investing, LLC
After having worked for over ten years within the field of energy and the environment, Dr.















