|

Nasdaq 100 ETF (QQQ) Elliott Wave signals double correction toward 684 [Video]

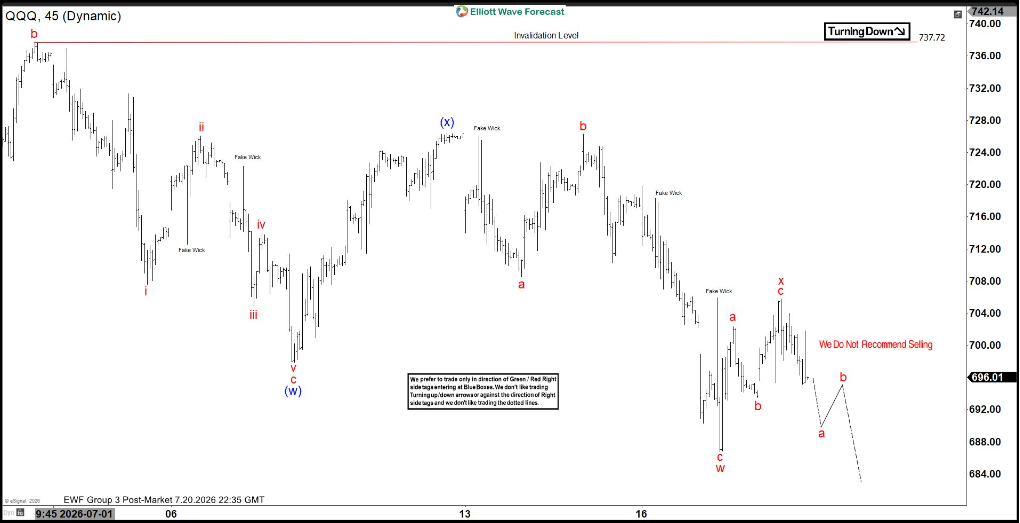
The short‑term Elliott Wave view on the Nasdaq 100 ETF (QQQ) shows that the instrument is correcting the cycle from the March 30, 2026 low. The decline from the June 3, 2026 all‑time high continues, with the extreme target zone defined by the 100%–161.8% Fibonacci extension. This area lies between $646 and $684 and represents the next logical support cluster within the ongoing correction.

From the June 16 high, the cycle has unfolded as a double three structure. Wave (w) ended at $697.86, followed by a counter‑trend rally in wave (x) that peaked at $726.40. The ETF then resumed lower in wave (y), which subdivides into another double three, highlighting the complexity of the correction.

Within wave (y), the decline from wave (x) produced wave w at $686.76. The subsequent rally in wave x ended at $705.80. The ETF has since turned lower again. A break beneath $686.76 is required to confirm that the correction is extending as a double sequence. Until then, the possibility of a more complex consolidation remains.

Near term, the pivot at $737.72 is critical. As long as this high remains intact, rallies are expected to fail in either three or seven swings. This reinforces the downside bias and favors continuation lower toward the $684 area, consistent with the projected Fibonacci extension zone.

Nasdaq 100 ETF 45-minute Elliott Wave chart
Nasdaq 100 ETF [Video]
Youtube preview

Author

Elliott Wave Forecast Team

Elliott Wave Forecast Team

ElliottWave-Forecast.com

More from Elliott Wave Forecast Team
Share:

Editor's Picks

GBP/USD clings to small gains near 1.3450 after UK jobs data

GBP/USD trades in positive territory at around 1.3450 in the European session on Tuesday. The UK ILO Unemployment Rate remained at 4.9% in the three months to May, compared with expectations of 5%, but failed to provide any impetus to the British Pound's renewed uptick. Traders stay cautious amid US-Iran uncertainty and the UK political transition.

EUR/USD keeps range above 1.1400 after German ZEW

EUR/USD is keeping its range above 1.1400 in Tuesday's European session, as the US Dollar (USD) retreats following Monday's rebound. Nevertheless, the uncertainty around the US-Iran conflict limits the pair's upside. Meanwhile, the Euro (EUR) pays little heed to the strong German sentiment data, as traders await Thursday's European Central Bank policy announcements, which could drive the Euro's near-term valuation.

Gold extends recovery toward $4,100

Gold gains traction following Monday's choppy action and advances toward $4,100 on Tuesday. However, the uncertainty surrounding the conflict in the Middle East and growing expectations for a hawkish Federal Reserve policy outlook could make it difficult for the precious metal to gather bullish momentum in the near term.

Bitcoin extends advance as ETF inflows, Iran war mediators' proposal lift risk mood

Bitcoin extends its gains, trading above $65,800 after closing above the key technical hurdle the previous day. The bullish price action is further supported by the return of institutional demand, with spot Exchange Traded Funds continuing their inflows on Monday. In addition, the renewed hopes for peace between the US and Iran have lifted risk sentiment, providing an additional tailwind for the Crypto King.

Buy the dip on the Dow Jones and S&P? Forex Trading Gold descending triangle

Trading during a war, a pandemic, during trade disputes, and other geopolitical events, especially when some major players are sociopathic, can be quite challenging. The Iran war is no exception. The Iran war is no exception.

US Dollar mid-year outlook: Exceptional currency, exceptional risks?
The US Dollar enters the second half of 2026 in a markedly different position from a year ago. The King currency has recovered, reflecting persistent US inflation, changing expectations for Fed policy, geopolitical tensions and renewed demand for defensive assets.
















