Morgan stanley: $1.1 Trillion AI Capex by 2027 turns the race
- The AI capex surge is no longer linear; it is exponential, with spending accelerating from $800bn toward $1.1tn in a race that is scaling faster than markets can comfortably digest.
- This is a volume story more than a price story, more chips, more power, more compute, as capability compounds and demand rises to meet it in real time.
- Equity markets are riding the revenue tailwind from this buildout, but credit markets are quietly absorbing the strain through record issuance and longer duration supply.
- The competitive dynamic is everything; this is not about efficiency but dominance, where the gap between first and fourth is measured in relevance, not margins.
- Price sensitivity is fading, and that has macro consequences, supporting productivity narratives on one side while quietly stoking inflation pressures through relentless, capital-intensive demand.

A rewrite of both the Morgan Stanley and Goldman Sachs latest missives.
1.1 Trillion AI Capex by 2027
Last weekend in London delivered the kind of blue sky that makes the city feel like a different market altogether, and it happened to frame a moment that speaks directly to what is unfolding in equities. London Marathon produced something extraordinary as Yomif Kejelcha broke the two-hour barrier with a 1:59:41, only to find himself eclipsed by Sabastian Sawe, who crossed the line 11 seconds quicker at 1:59:30. Same road, same 26.2 miles, but in a race run at record pace, even a handful of seconds redraws the hierarchy.
That dynamic feels eerily familiar when you look at the biggest non-geopolitical story driving markets right now: the surge in AI infrastructure spending. This is not an incremental investment; it is a full sprint where the difference between leading the pack and trailing it is measured in fractions, yet priced in billions. The pace is relentless, the margins are thin, and the rewards are massively skewed toward those who cross the line first.
What stands out immediately is the scale. Morgan Stanley estimates that US hyperscalers will deploy more than $800 billion in capex in 2026 alone. That figure is not just large; it is dislocating, effectively matching what the entire non-tech cohort of the S&P 500 spent the prior year. This is what a record pace looks like in capital terms, a market not walking forward, but running flat out with no guarantee that second place even matters.
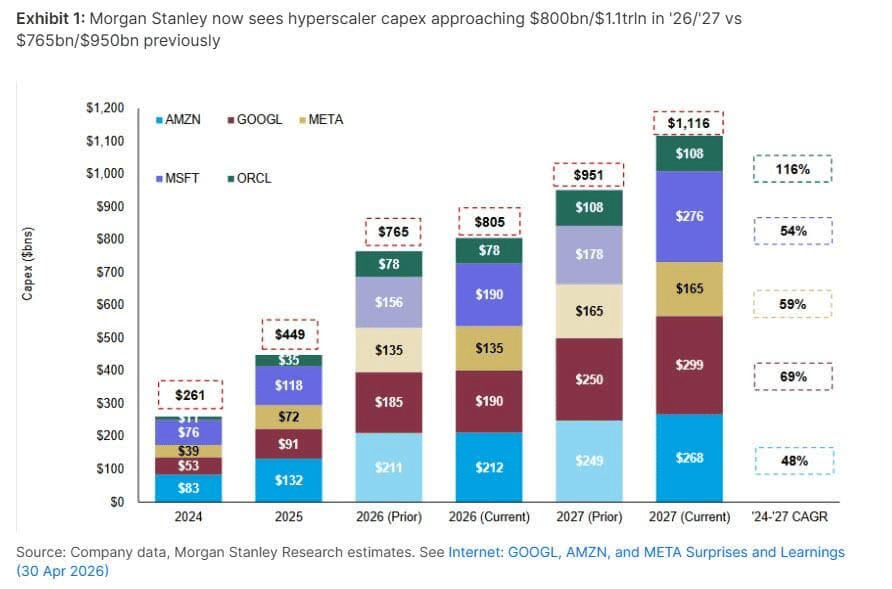
The acceleration is what really grabs you. That roughly $800 billion in hyperscaler capex pencilled in for 2026 is not just an increase, it is a step change, nearly double 2025 and triple 2024, with the curve still pointing higher as projections push toward $1.1 trillion the following year. Some of that lift is price; the cost of building intelligence has gone up, but the dominant force is volume: more demand, more chips, more power, more of everything. In just four years, the core building blocks, chips, memory, and clustered compute have become four to seven times more capable, and the trajectory is still steepening. NVIDIA sits at the center of that surge, with compute volumes projected to expand at a blistering pace that compounds into something almost exponential if extended over the next cycle.
The obvious question lingers beneath the surface: if you build it, will they come? Early signals suggest they already are. Google recently flagged processing 16 billion tokens per minute, a figure that jumped 60% quarter on quarter, hinting that demand is not just real but accelerating into the infrastructure being laid down. The next inflection likely arrives with a new generation of models trained on vastly more powerful systems, effectively stress testing whether last year’s capex binge translates into real-world capability and monetization.
The market has not been blind to any of this. One company’s capex is another company’s revenue stream, and the winners in this tape have been those sitting closest to the buildout. Semiconductor stocks surged sharply through April, riding the wave of this once-in-a-generation capital cycle, while the broader narrative continues to orbit around AI beneficiaries. But this is not just an equity story; it is increasingly a credit story as well. Even the largest balance sheets in corporate history are not immune to the scale of these outlays, and funding them requires tapping debt markets at scale. Investment-grade issuance is already running well ahead of last year, much of it extending further out the curve, quietly increasing the duration load the market needs to absorb.
That creates an awkward asymmetry. If the spending engine keeps roaring, equities can remain supported by the revenue tailwind, but credit has to digest a steady drumbeat of supply that pressures spreads. If the spending slows, the sentiment hit rolls through risk assets more broadly, and credit does not escape the downdraft. Either way, the cushion looks thinner.
Running through all of this is the story's competitive core. The biggest spenders are not experimenting; they are racing, and the gap between leading and lagging is measured not in percentages but in strategic relevance. In that kind of contest, price sensitivity fades into the background. Component costs, funding costs, and even near-term share price volatility become secondary to securing a position in what is seen as a defining technological shift.
That has macro consequences as well. Voices like Kevin Warsh argue that this wave of investment could lift productivity enough to justify lower rates over time, yet the flip side is already visible, as price-insensitive demand starts to press against real-world constraints, from memory pricing to power availability. The speed of the buildout, the willingness to spend through cycles, and the eventual productivity payoff are all variables still in motion.
For most participants, this is not a race we can run, but it is one we can watch unfold in real time, a field of well-funded giants pushing the pace higher with each lap, knowing that in a contest like this, finishing second is often just another way of losing.
Author

Stephen Innes
SPI Asset Management
With more than 25 years of experience, Stephen has a deep-seated knowledge of G10 and Asian currency markets as well as precious metal and oil markets.

















