|

McDonald’s Corp. (MCD) Elliott Wave technical analysis

MCD Elliott Wave technical analysis

Function: Trend 

Mode: Impulsive  

Structuue: Motive 

Position: Wave {iii} of 1.  

Direction: Upside into wave 1.  

Details: Looking for a five wave move completion within wave 1 as we are now approaching TradingLevel3 at 300$.

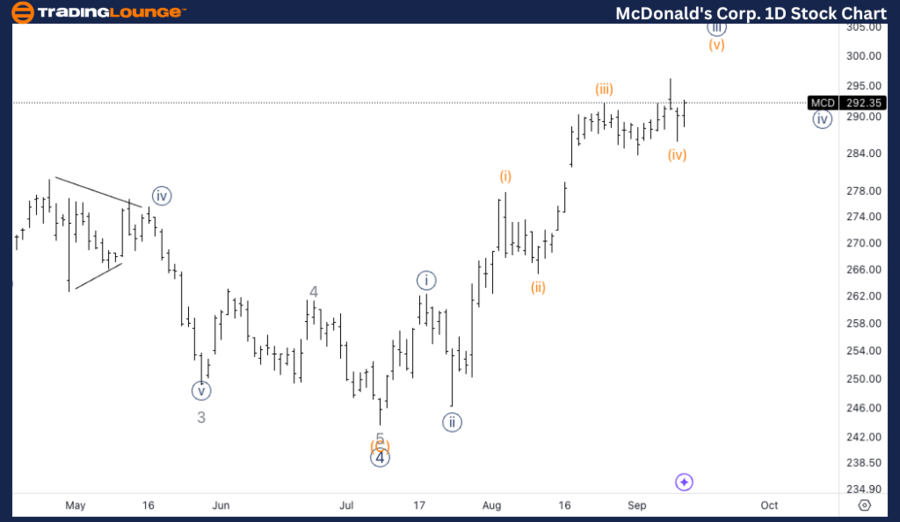
MCD Elliott Wave technical analysis – Daily chart

In the daily chart, McDonald's is showing a clear impulsive trend, currently progressing within Wave {iii} of 1. This suggests the stock is in the midst of a strong upside move. As the price approaches the critical level at $300, known as TradingLevel3 (TL3), we are looking for the completion of a five-wave move within this initial wave 1. 

Chart

MCD Elliott Wave technical analysis

Function: Trend. 

Mode: Impulsive. 

Strucutre: Motive. 

Position: Wave i of (v).  

Direction: Looking for upside into wave (v). 

Details: Looking for upside into wave (v) as we seem to have a flat in wave (iv) and we found support on top of the end of Minor Group 2 at 280$.

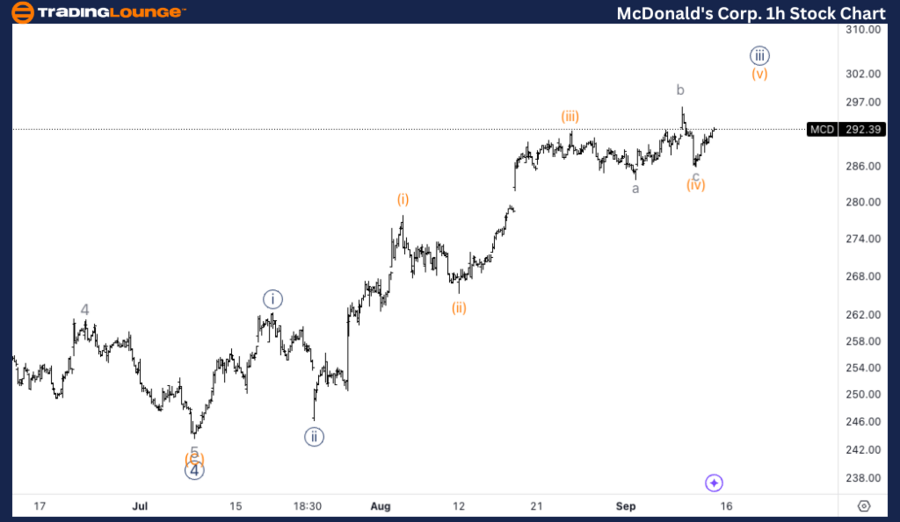
MCD Elliott Wave technical analysis – One-hour chart

On the 1-hour chart, MCD appears to be progressing within Wave i of (v), signaling that we are likely entering the final leg of the current impulsive sequence. The recent Wave (iv) formed a flat corrective structure, and the stock found key support around $280, which corresponds to the end of MinorGroup2.

Chart

In this Elliott Wave analysis of McDonald’s Corp. (MCD), we assess its current price action and wave structure using Elliott Wave Theory to help identify trading opportunities. Both the daily and 1-hour charts are examined to provide a comprehensive outlook for traders. 

McDonald’s Corp. (MCD) Elliott Wave technical analysis

Author

Peter Mathers

Peter Mathers

TradingLounge

Peter Mathers started actively trading in 1982. He began his career at Hoei and Shoin, a Japanese futures trading company.

More from Peter Mathers
Share:

Editor's Picks

GBP/USD surges to multi-day peaks past 1.3250

GBP/USD leaves behind Friday’s small pullback and advances past 1.3250 level, or five-day highs, on Monday. Cable’s upside follows extra losses in the Greenback, while traders continue to assess the geopolitical front and upcoming key events.

EUR/USD softens to near 1.1400 as ECB tightening bets fade

The EUR/USD pair trades with mild losses around 1.1415 during the early Asian session on Tuesday. The Euro softens against the US Dollar as traders reduce their bets on the European Central Bank rate hikes this year.

Gold tumbles 1.5% to fresh seven-month lows below $3,950

Gold remains under strong selling pressure for the second straight day early Tuesday, refreshing seven-month lows below $3,950. Renewed US-Iran hostilities over the weekend cast doubts over the sustainability of the peace deal. This, along with elevated expectations for Fed rate hikes, offers some support to the US Dollar and undermines the bullion.

Bitcoin stalls at $60K as buyer conviction fades, Strategy authorizes BTC sales

Bitcoin is trading around the $60,000 level on Monday after a sharp decline last week. With the top crypto struggling to recover, analysts suggest the market remains firmly in defensive territory as investors await stronger signs of demand.

Just like Fed, is BoJ’s independence under threat?

When talking about central bank independence, most of the focus has been on Donald Trump’s pressure on the Federal Reserve. But a similar story, a quieter one for now, seems to be happening on the other side of the Pacific: Japan’s government may be testing the Bank of Japan’s independence.

Kevin Warsh isn't expected to say much in Sintra: That's exactly why markets will listen

Financial markets could find an important catalyst in the enchanting, fairytale-like landscape of Sintra this week. The ECB Forum will, as it does every year, gather the crème de la crème of central banks. The new boss at the Fed, who has clearly said that the Fed should stop explaining everything, will need to talk – and traders should listen.